
Data Contextualization
At this point, you could begin consuming data using Canary's visualization tool, Axiom, the Excel Add-in, or pull the data into a 3rd party application using Canary's ODBC Connector or Read API; however, we want to present the data structure in a way that is more useful for the end user.
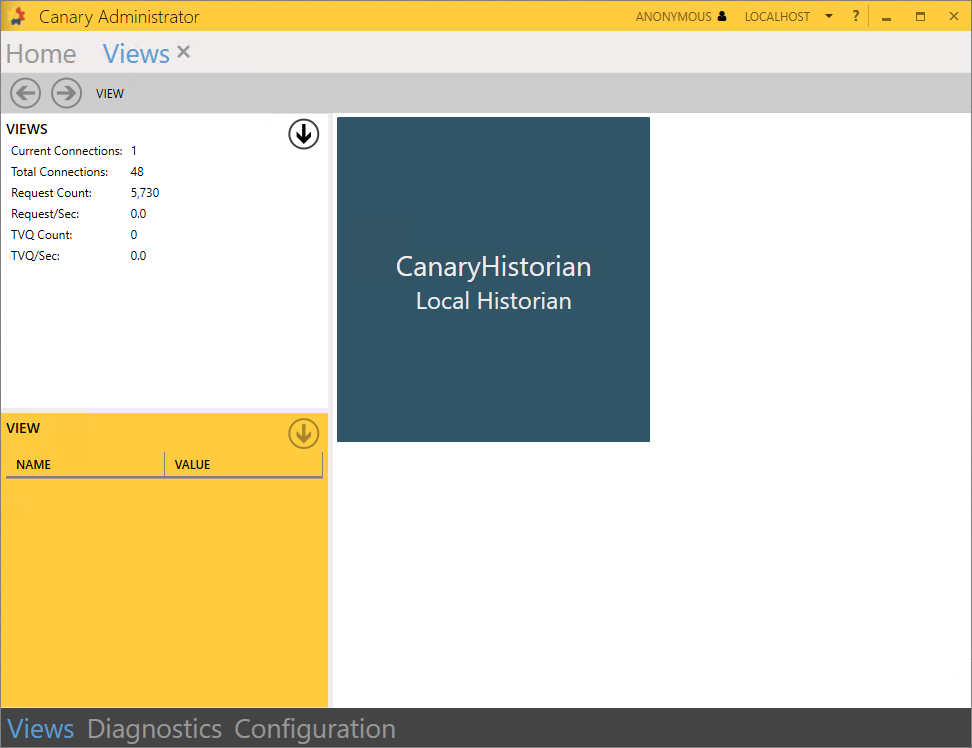
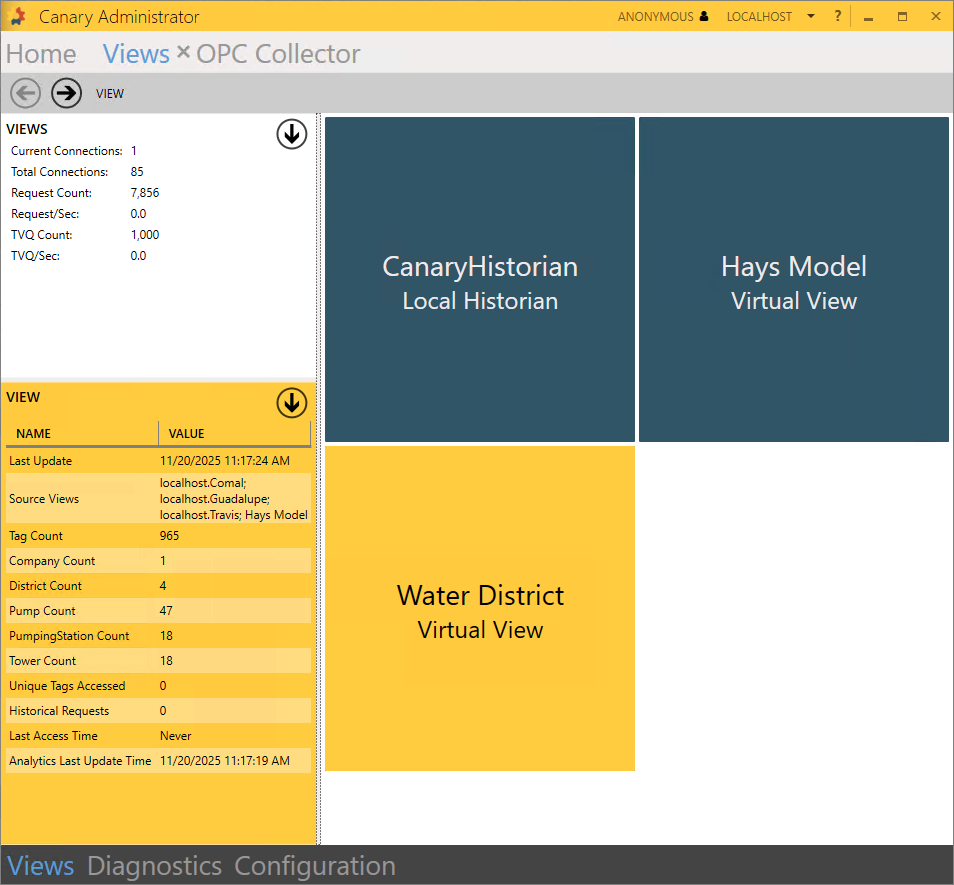
All clients wishing to consume data are routed through the Views service which acts as a gateway to the Historian. Out of the box, Canary offers the Local Historian view which you can see when you open the Views tile.
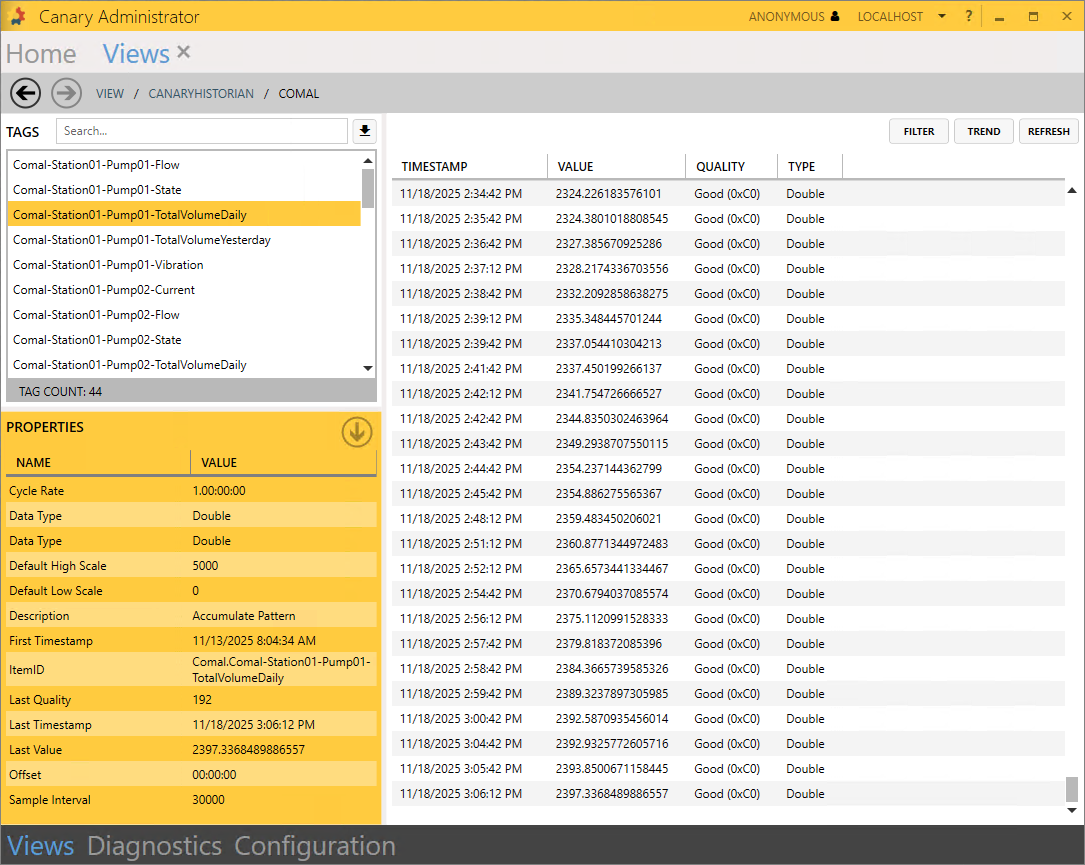
Drilling into the view will display the DataSets which are available in the Historian. The user may drill as far down as they would like until they reach the tag level. The browse structure presented here is the same as what an end user would see if they were using any other Canary client tool.
Similar to how you would view the data in the Historian tile, the user can select a tag from the left to see its TVQ's on the right. Only this time, the data is not limited to a single HDB file as it is in the Historian. The user can scroll back through its entire history.
Virtual Views
Aside from the Local Historian view, the user has the option of creating Virtual Views. A virtual view accomplishes two main goals:
- Aliasing tag names
- Defining assets
Sometimes the tag name coming from SCADA is too cryptic or does not have enough context for the end users consuming it. In this project, the naming convention for each DataSet differs depending on the source. With a virtual view, a user can standardize the naming convention without having to change the tag name at the source which can be costly. In this way, data consumers are given a better experience because tag paths are predictable and intuitive.
By defining assets, other components of Canary (primarily Axiom and Calcs & Events) become more dynamic and allow users to create robust dashboards and calculations that iterate over an entire asset type instead of creating one-to-one calculations. (More on this later.)
Virtual views are typically built on top of DataSets coming from the Local Historian view, but they can also be built on top of other virtual views which we will look at in this module. For our use case, we will first build a virtual view using the Hays DataSet, then pass that in to another view which will include the other 3 DataSets. A user may find it easier to build an "enterprise" view if they first build some subviews which target a single data source, especially if the naming convention between the data sources varies greatly.
Creating a Virtual View (Hays Model)
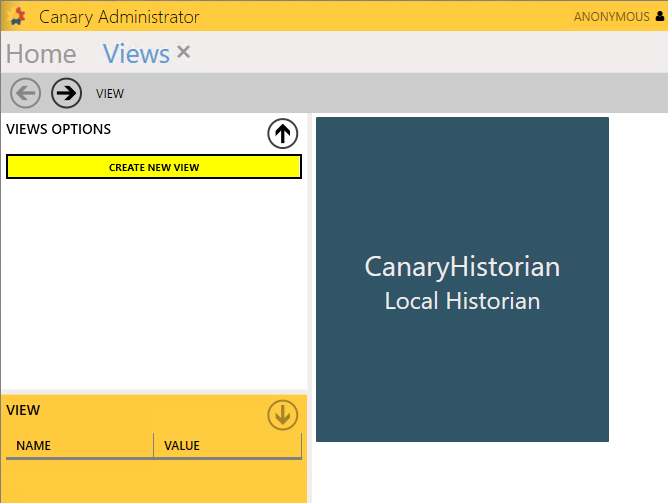
- Navigate back to the top level of Views and click the white down-arrow to CREATE NEW VIEW.
- Name the view 'Hays Model' and select the Hays DataSet as its Source View.
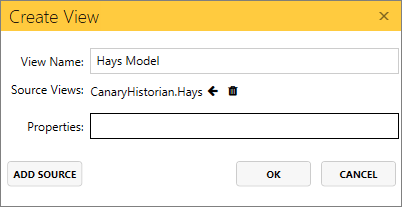
- Include the 'Description' property which we configured when we set up the logging session for Hays. Click OK.
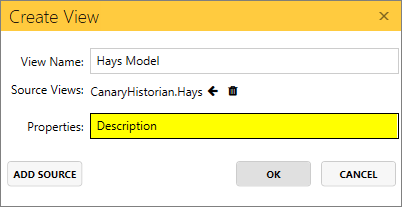
Properties are optional. They are only passed into a view when needing to provide additional context if there is not enough information within the tag name itself. When properties are passed in, they are appended to the end of the tag name and separated with '##'. If a tag does not have the listed property, it will appear as '##NA'.
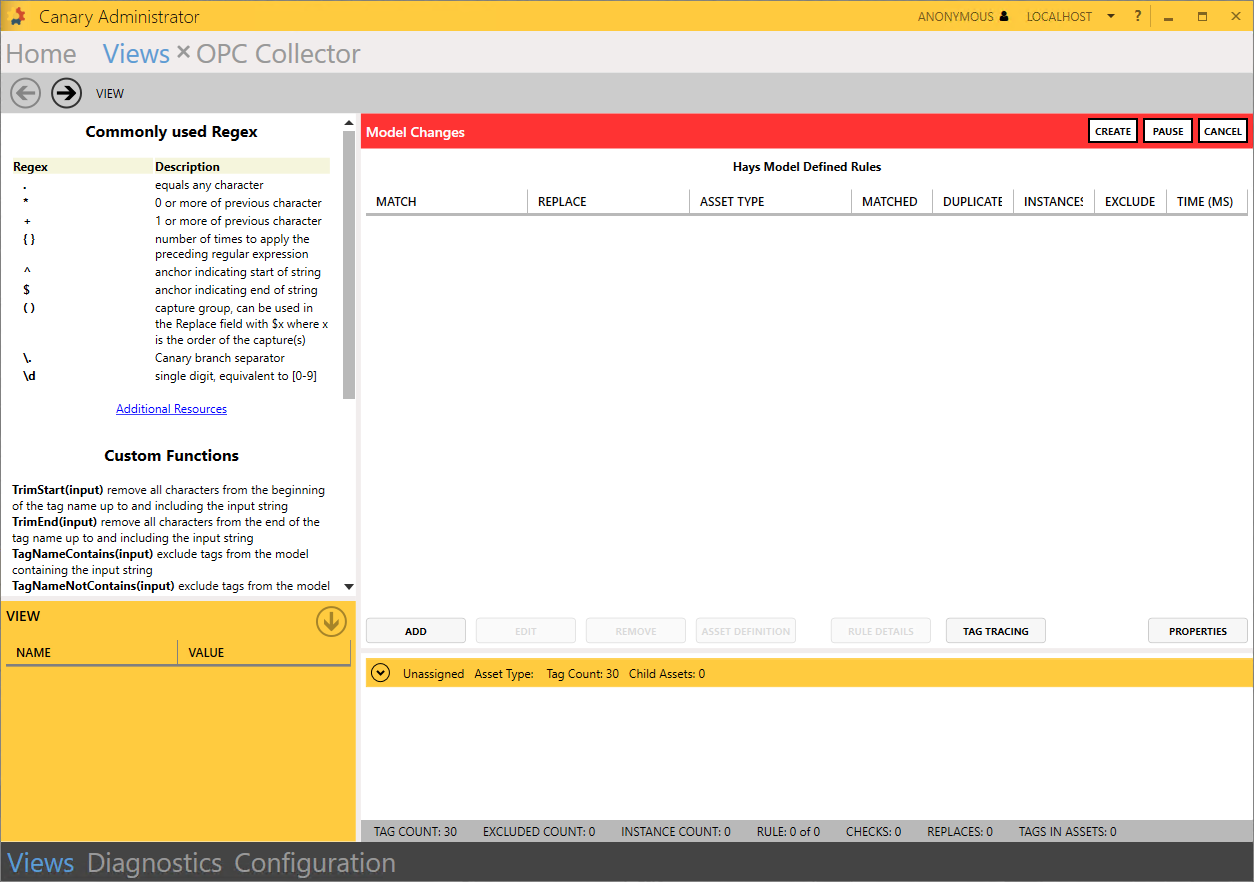
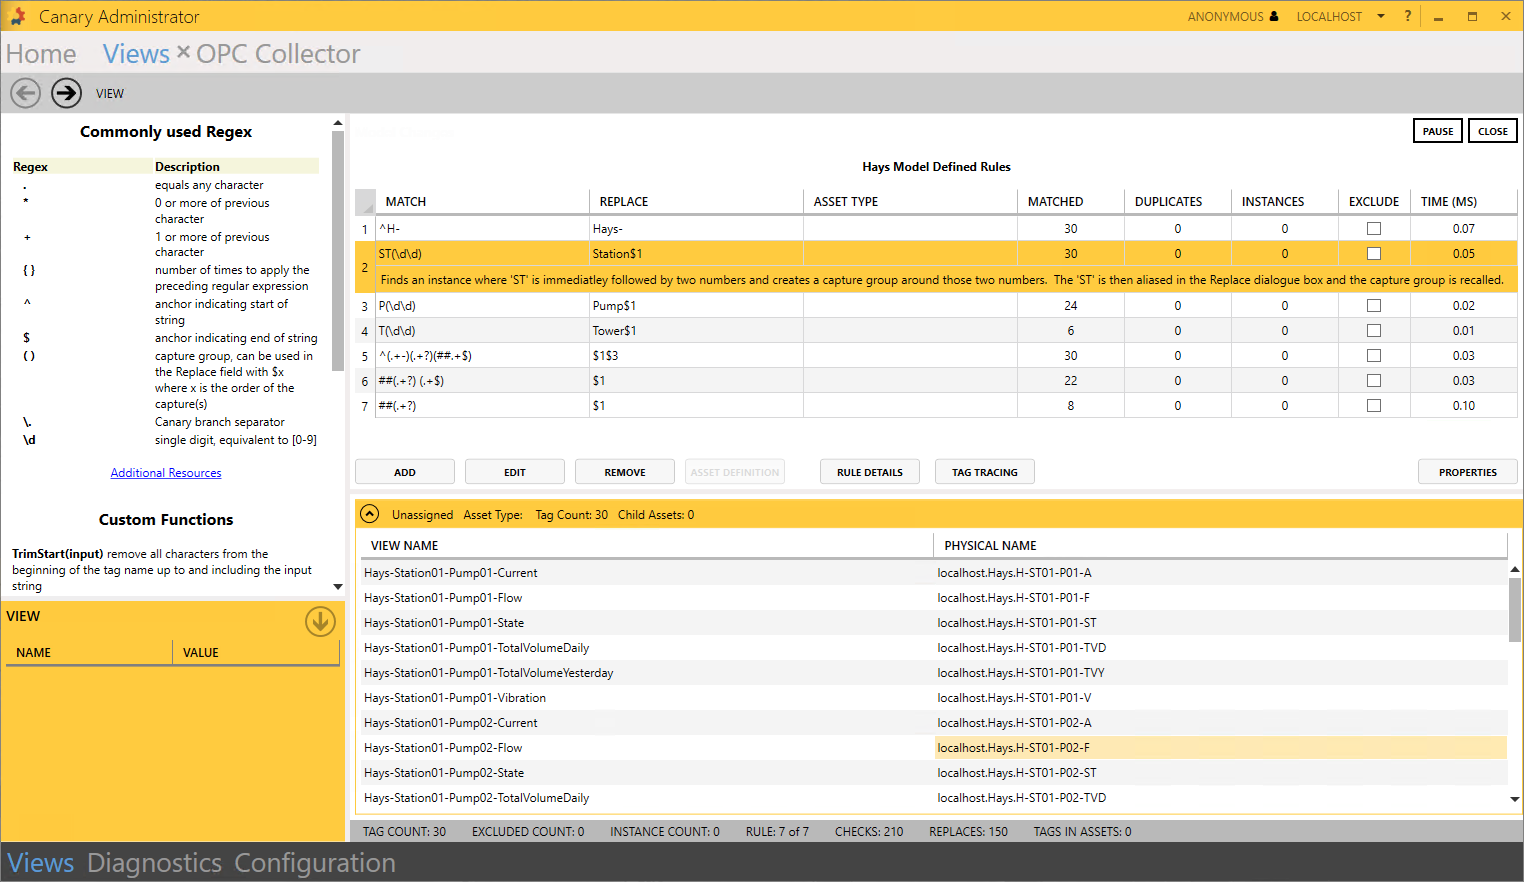
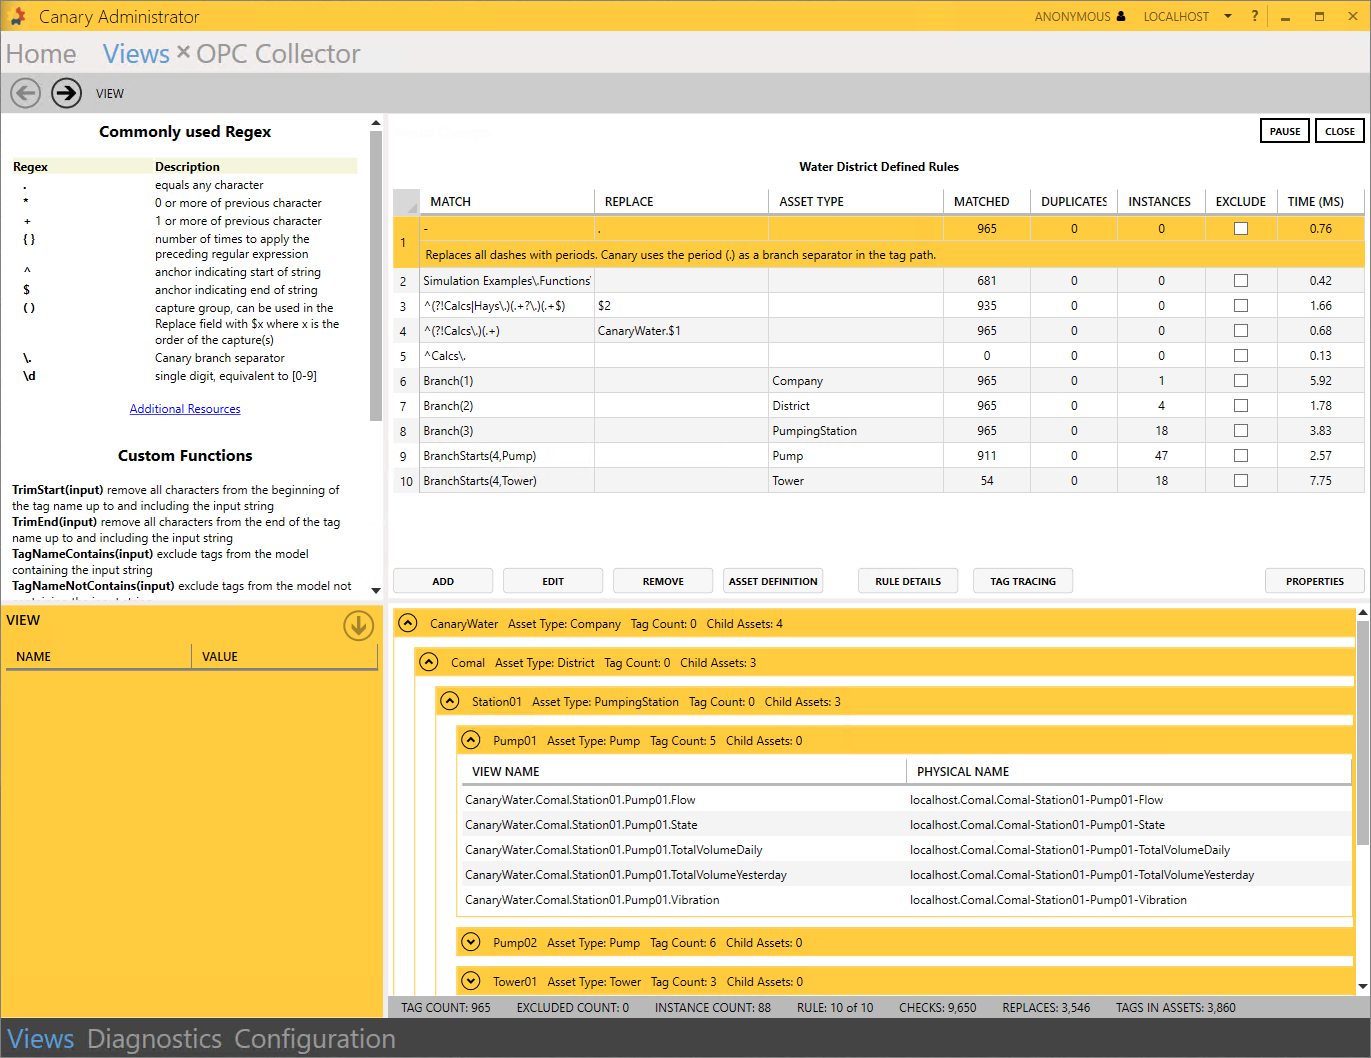
Virtual Views are built using regular expressions to find and replace string patterns found within the tag path (and the properties appended to the end of the tag path) to alter their naming convention and/or define assets. A list of commonly used regular expressions and custom functions are located in the top-left window.
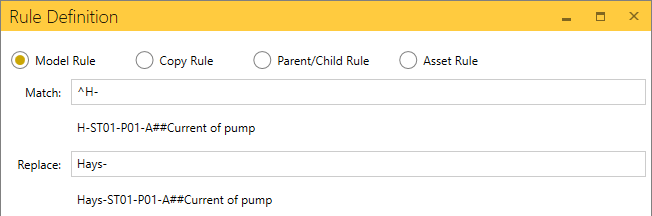
At this point, a user would ADD RegEx rules to manipulate the tag structure into the desired naming convention using Model Rules.
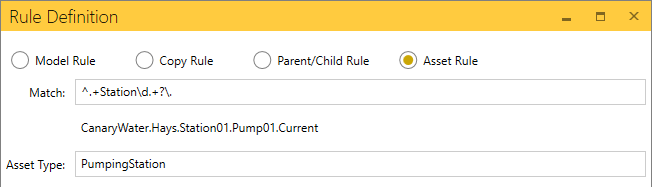
Once the desired tag structure is achieved through a series of Model Rules, the user would then introduce Asset Rules to define asset types at different levels within that structure.
For this project, we will import a text file which contains all of the rules we need to modify the tag names. This methodology can be useful in a real world scenario if wanting to migrate a virtual view from one Canary server to another.
- Download the Hays Model Rules.txt file attached at the top of the module.
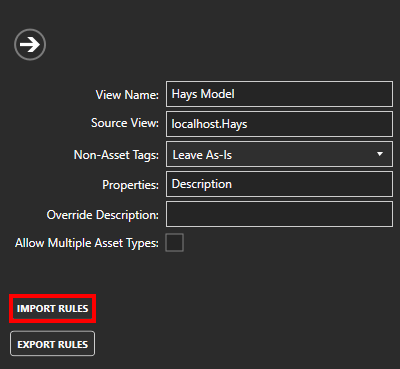
- Click the PROPERTIES button on the right side of the screen then select IMPORT RULES. Browse for the Hays Model Rules.txt file.
- Collapse the PROPERTIES fly-in menu and click the CREATE button. Seven rules should appear in the table. Selecting a rule will display a comment describing its purpose. Rules are processed in chronological order. Expanding the yellow bar at the bottom of the screen will display the new VIEW NAME and its original PHYSICAL NAME.
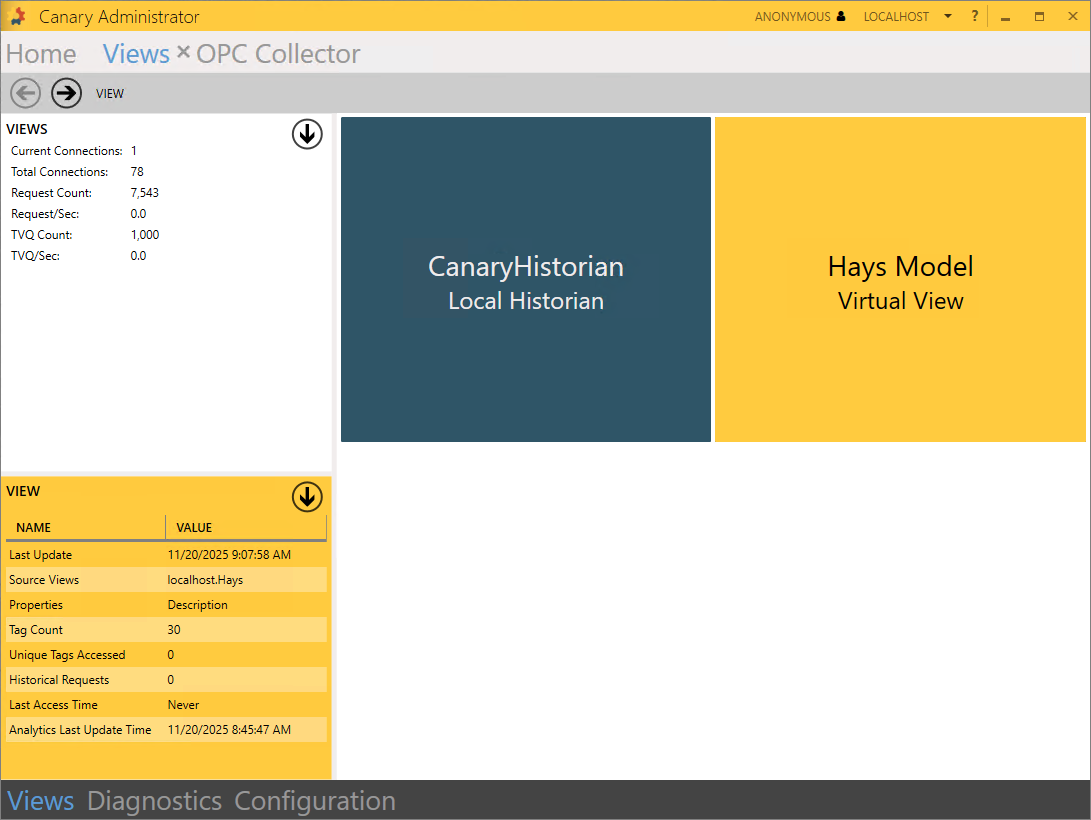
- CLOSE the edit screen and a new tile will appear with the Hays Model Virtual View.
Creating the Water District Virtual View
With the Hays Model built, we will create another virtual view using this model and the other 3 DataSets from the Local Historian view.
- Select the white down-arrow to CREATE NEW VIEW.
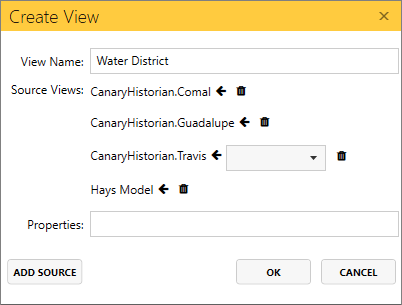
- Name the view 'Water District' and add 4 source views (Comal, Guadalupe, Travis, Hays Model) using the ADD SOURCE button and click OK. We do not need to include properties this time.
- Click the PROPERTIES button when the edit screen appears and import the Water District Rules.txt file attached at the top of the module.
- Collapse the PROPERTIES fly-in menu and click CREATE. You should see 10 rules altogether. The first 5 rules are Model Rules, trimming and replacing parts of the tag path to transform it into the desired naming convention. The last 5 are Asset Rules defining an asset type at different levels of the hierarchy. You may want to click through each rule and see the comments for each one. You will notice a reference to a 'Calcs' DataSet. This is planning ahead for the calculations we will create in the next module.
- CLOSE the edit screen. A tile for the Water District Virtual View should now be available. The VIEW window in the bottom-left displays the last time the view was built, its Source Views, the total number of tags, the number of each asset type, and some usage analytics.
Views Navigation
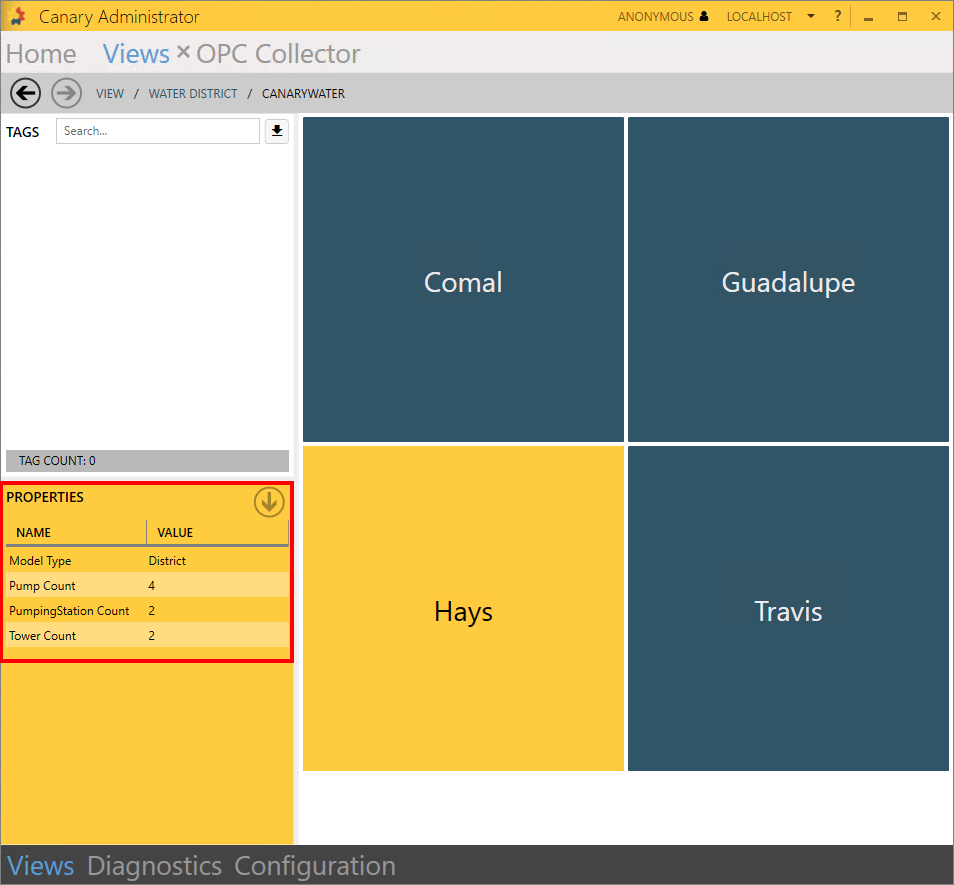
When you drill into the view, you will notice there is a screen for each branch level within the tag path. Canary uses the period (.) as a branch separator. If any tags exist at that level, they will appear in the TAGS window for the user to select. In this particular model, all of the tags reside at the very end when drilling all the way to the bottom. Selecting a tile will display its Model Type (if there is one) and any child assets that fall underneath that particular node in the PROPERTIES window.
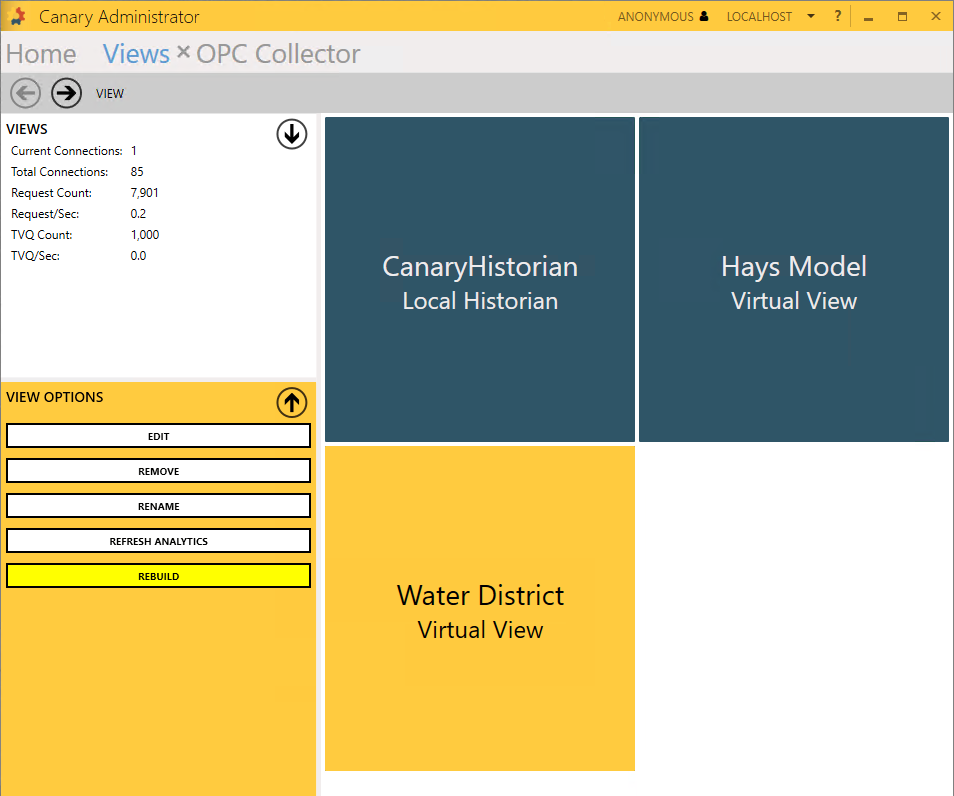
A virtual view will automatically rebuild when any of the Source Views feeding it have tags added or removed, or if their tags' property values change. This rebuild occurs every 5 minutes if there are changes to be made. A user can manually force this rebuild by selecting the virtual view and clicking the REBUILD button from the VIEW OPTIONS menu.
For more information on Virtual Views, see Virtual Views and Asset Models.