Data Logging
For this part of the project we will be configuring the OPC and MQTT Collectors to log data to their respective DataSets in the Historian. OPC logging sessions will target a Kepware instance hosted in the cloud (datagen.canarylabs.online). MQTT logging sessions will utilize Canary's Data Generation service to publish data to a local Mosquitto broker which the MQTT Collector will connect to.
The attached files at the top of the article will need to be downloaded to complete the following logging configurations.
Configuring the OPC Collector
The OPC Collector is Canary's OPC UA client. (Canary offers a separate client, the Logger Admin, to connect to an OPC DA server.) The OPC Collector has two different methods for logging data: tag-based and path-based. A tag-based session allows the user to browse the OPC server and select the tags of their choice. This type of session also allows the user to paste in a spreadsheet of tags and properties if selecting individual tags would be too time-consuming.
The path-based session operates similar to an MQTT scenario in which the user can "subscribe" to one or more nodes within the OPC server. Any tags that fall under the selected node(s) will be logged by default, but filters can be applied to either include or exclude certain tags that fall under the given node(s). We'll create an example of each in this module.
Creating a Tag-Based Logging Session
- Open the OPC Collector tile and select the Configuration tab at the bottom.
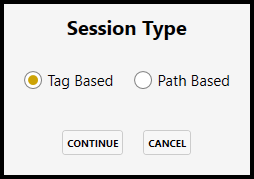
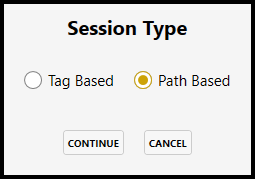
- Click NEW SESSION and select the Tag Based session type.
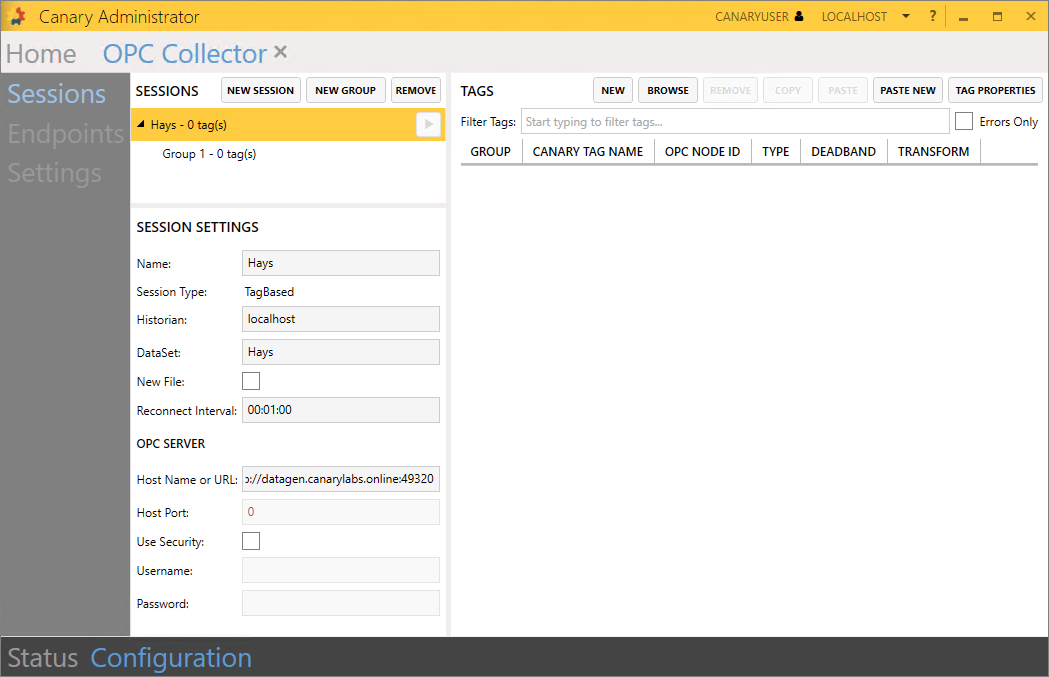
- Fill in the following SESSION SETTINGS and APPLY changes.
- Name = Hays
- DataSet = Hays
- Host Name or URL = opc.tcp://datagen.canarylabs.online:49320
Creating a Tag Group
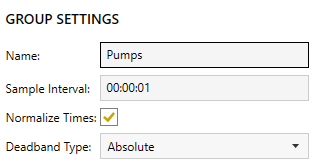
Tag Groups are used for a few reasons within a logging session. First, they allow the user to place tags into intuitive groups for organization. Also, at the group level, users can set the Sample Interval (how frequently the Collector would like to receive updates from the OPC server), enable timestamp normalization, and set the Deadband Type. At a minimum a session will have one group, but more can be added if needing to organize or differentiate settings between groups. For this project, multiple groups are added strictly for organization.
- Select 'Group 1' under the Hays session and change the Name to 'Pumps'.
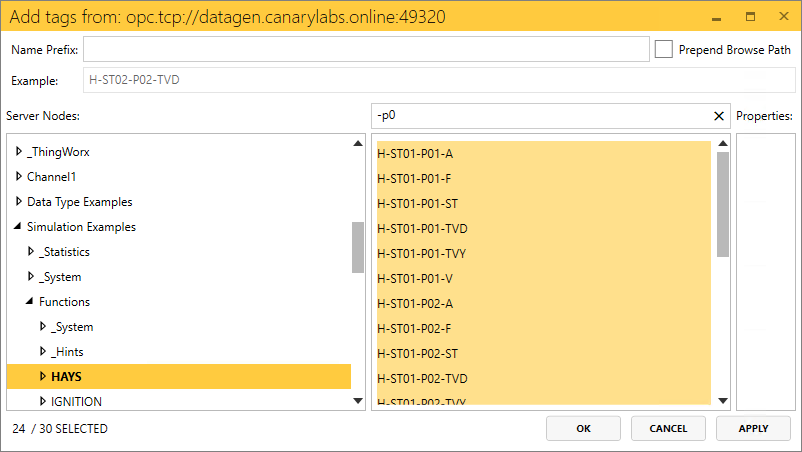
- Click the BROWSE button to add tags to the group. Under Server Nodes, navigate to Simulation Examples>Functions>HAYS.
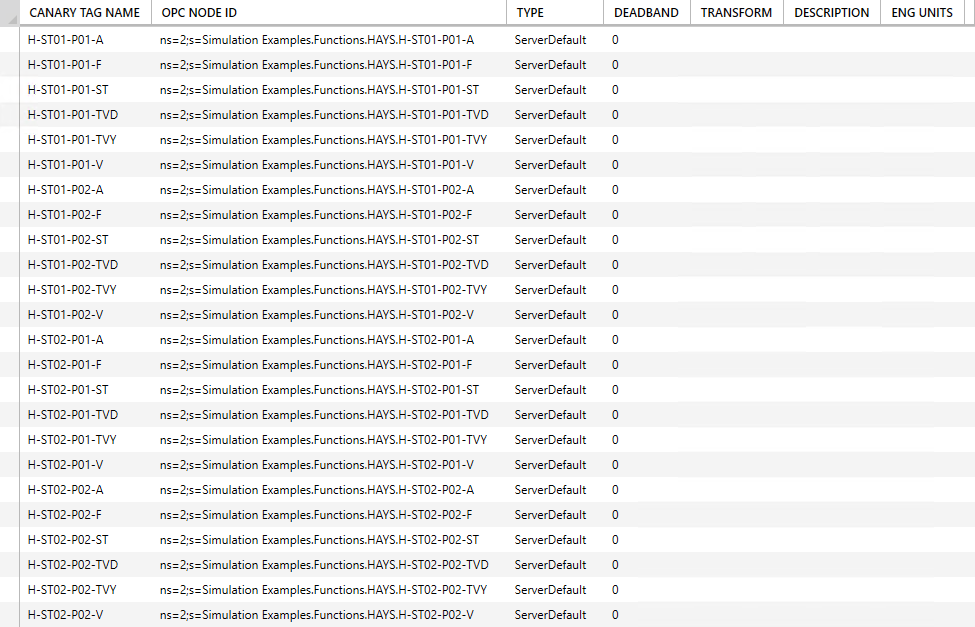
- Filter the tags on the right using the string "-p0". Use a Shift+Click or Ctrl+A to select all of the tags in the list and click OK then APPLY changes.
Adding Tag Properties
- Click the TAG PROPERTIES button and add 'Description' and 'Eng Units' from the drop-down list. (Custom properties can be typed in if they do not already exist in the list.) APPLY changes and two new property columns will appear in the table.
Property values can be updated one by one by selecting the tag from the table and updating the property field in the TAG SETTINGS window in the bottom-left window. If the property exists in the OPC server, the user can specify its Node ID captured within square brackets. An example of each in shown in the figure below.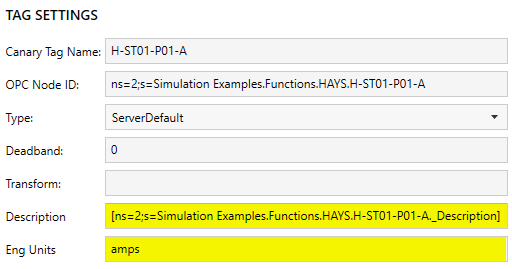
- For this project we will paste in a spreadsheet of property values. Open the Hays Logging Configuration.xls file attached at the top of the article and copy the contents of the Hays Pumps spreadsheet. Do NOT include the column headers.
Select the first cell under the Description column in the Canary Admin and click PASTE. The property values should appear in their respective columns. APPLY changes.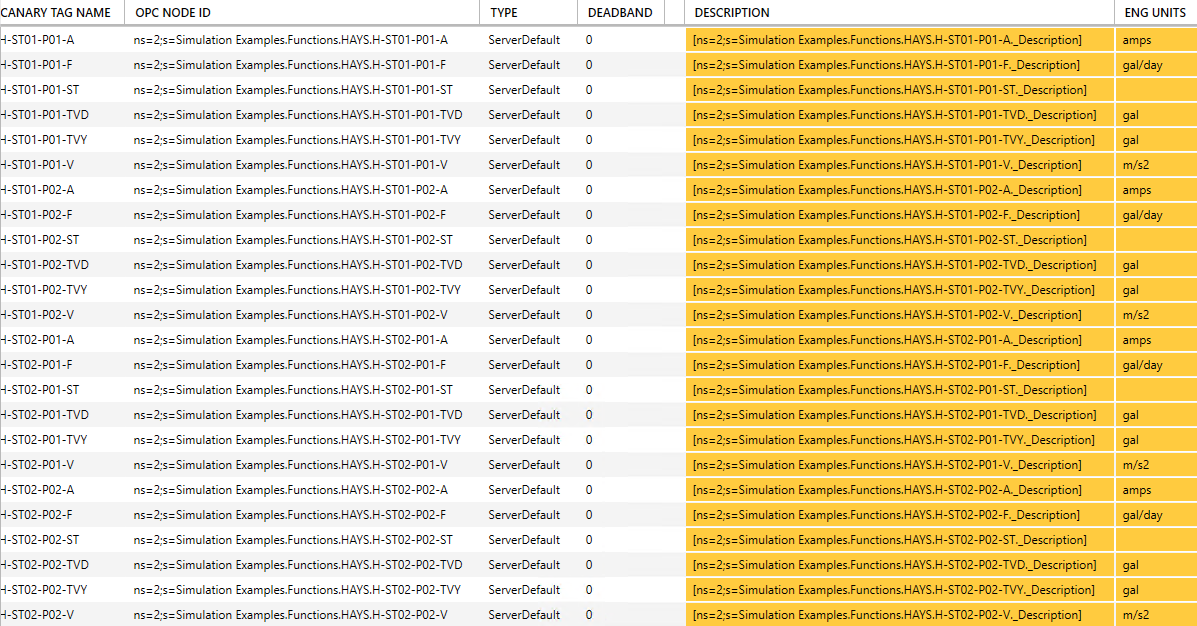
Adding Another Tag Group
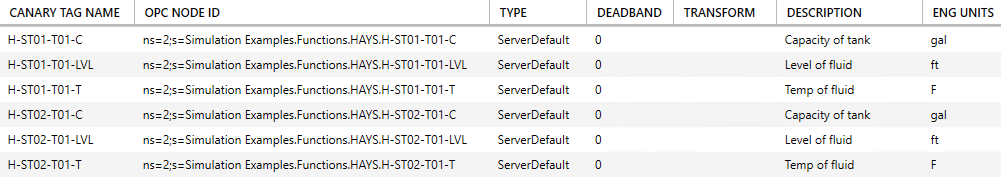
We will add another tag group to the Hays logging session, but instead of browsing for tags, we will paste both the tags and their properties from the spreadsheet.
- Select the NEW GROUP button and name it 'Towers'. APPLY changes.
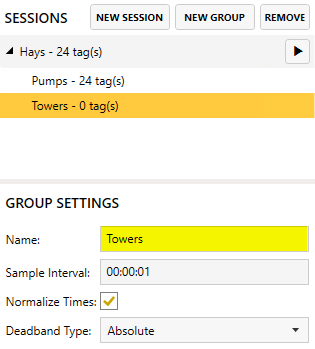
- Copy the contents of the Hays Towers spreadsheet. Do NOT include the column headers.
- Click the PASTE NEW button and APPLY changes.
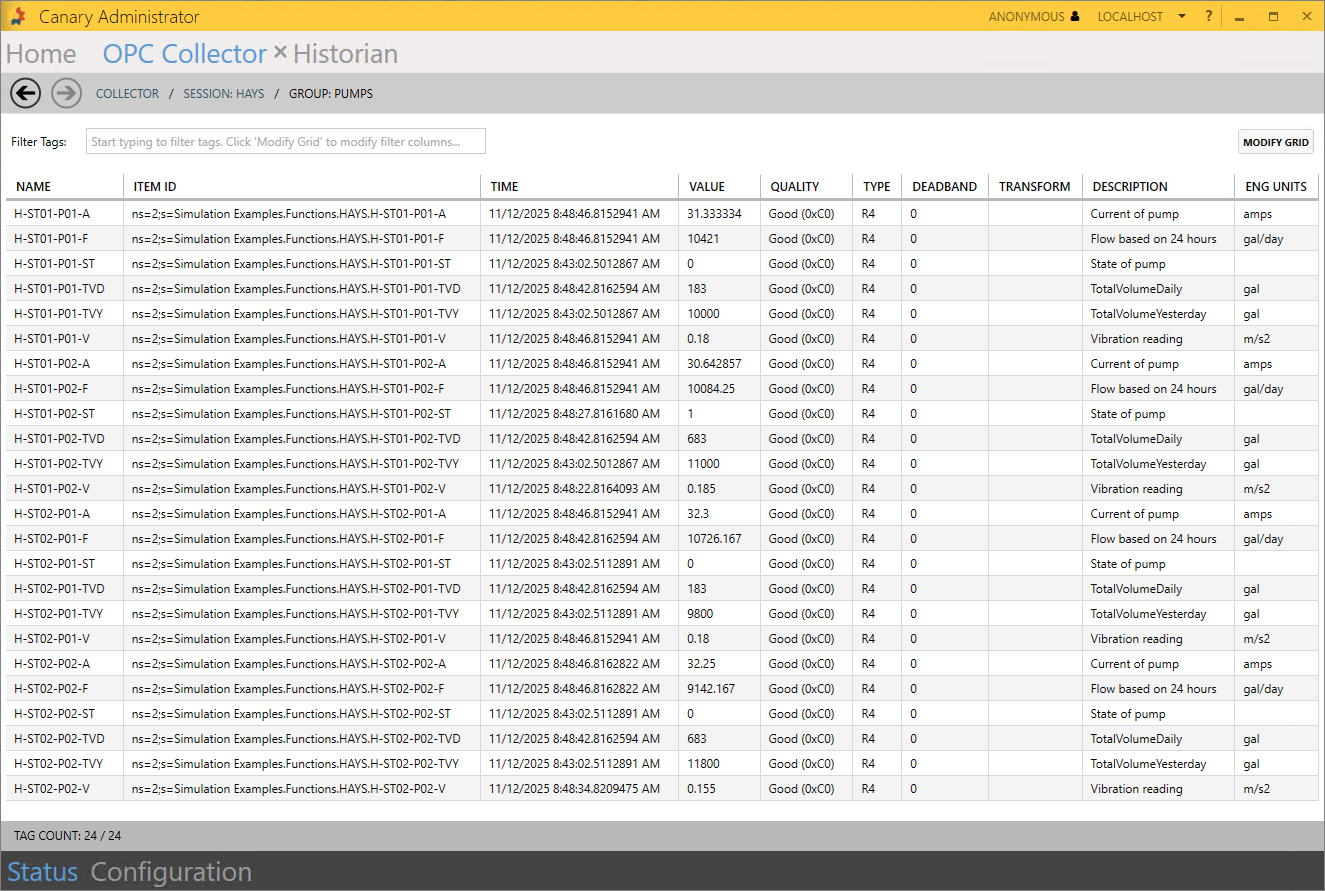
Begin Logging
Click the Play button next to the Hays session name to begin logging. You can verify data is being logged by selecting the Status tab at the bottom of the screen. The Hays tile should display 2 groups, 30 tags, and TVQs/Sec. Double-clicking or selecting the right arrow on the tile will allow you to drill into the session and choose a group to view. Selecting the Pumps or Towers tile will open a screen displaying the updates for each tag. This screen updates every 5 seconds.
Next, we'll create another logging session, only this time, we will look at a path-based session.
Creating a Path-Based Logging Session
- Navigate to the Configuration screen and create a NEW SESSION.
- Select the Path Based session type.
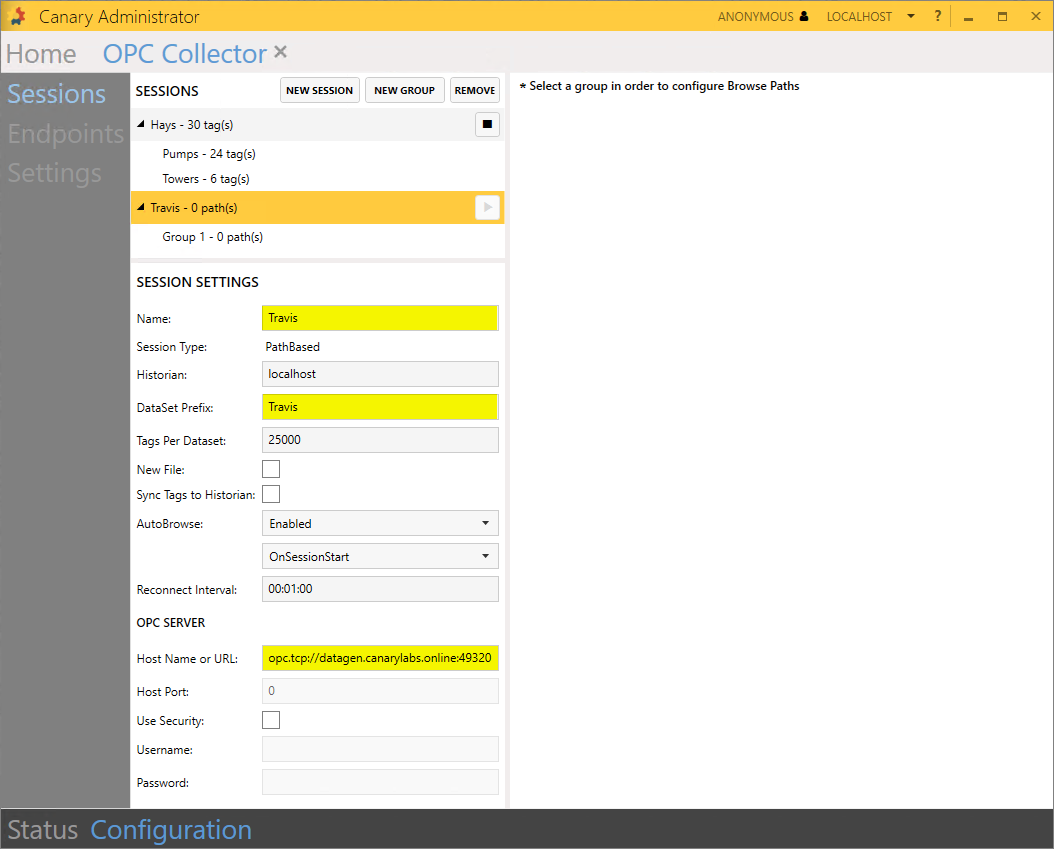
- Fill in the following SESSION SETTINGS and APPLY changes.
- Name = Travis
- DataSet Prefix = Travis
- Host Name or URL = opc.tcp://datagen.canarylabs.online:49320
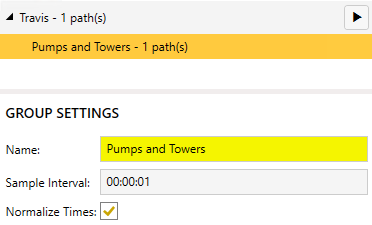
- Select 'Group 1' and change its Name to 'Pumps and Towers'.
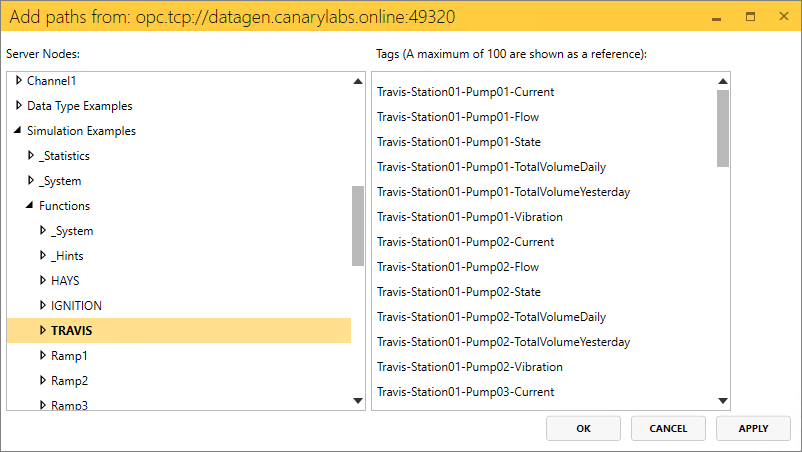
- BROWSE the OPC server and select the Simulation Examples>Functions>TRAVIS node. The window on the right will display a preview of the tags that fall under the selected node. Click OK.
- Using the Filters text box, type in the string '\._' and click ADD. This will exclude any tag under the path that contains a literal period followed by an underscore.
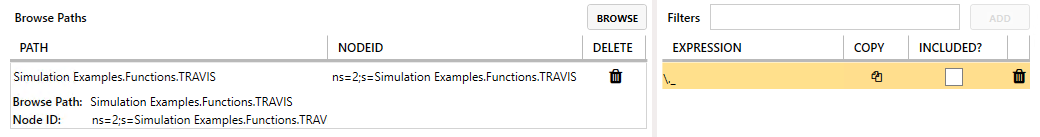
In this example, each tag has its properties listed as subnodes in the OPC server which start with an underscore. We do not want to log these properties as tags in the Historian so we exclude them with this filter.
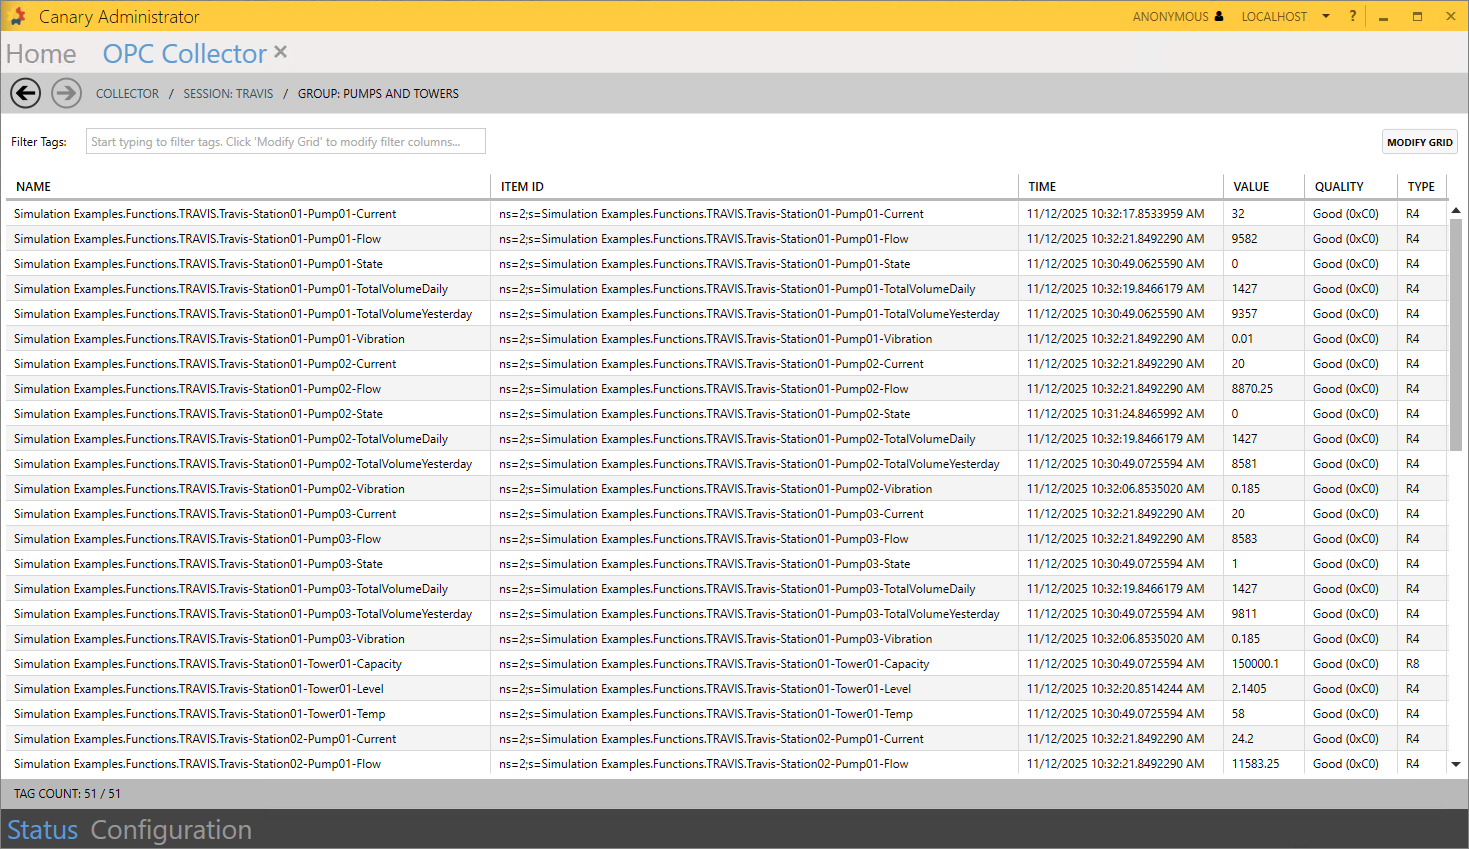
- Click the Play button next to the Travis session name and verify that data is logging by navigating to the Status screen and drilling into the Travis>Pumps and Towers group. There should be 51 tags in the table.
Configuring the MQTT Collector
The MQTT Collector acts as a subscriber client connecting to an MQTT server. It can consume a Sparkplug B and JSON payload. For this module, we will use a Sparkplug B payload and publish data to a local Mosquitto broker using the Data Generation service then use the MQTT Collector to store it in the Historian.
Mosquitto and Data Generation Configuration
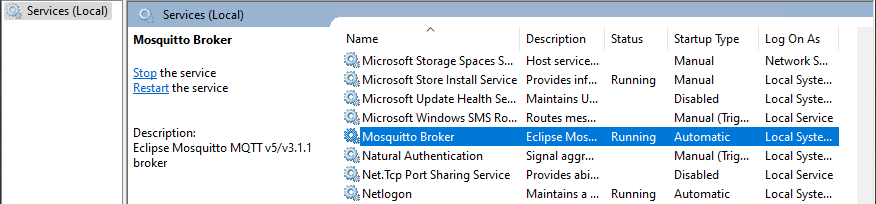
- Open Windows Services and start Canary Data Generation and Mosqitto Broker.
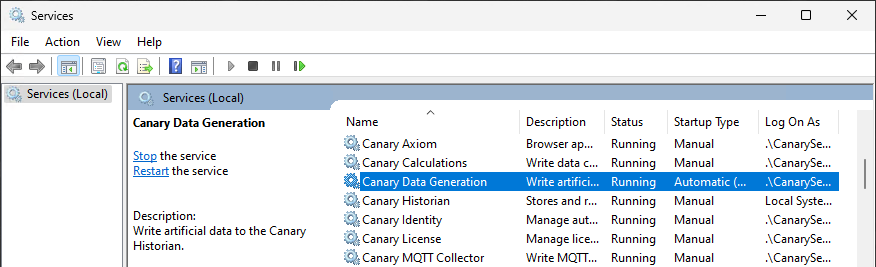
You may want to change the Canary Data Generation service to use an Automatic (Delayed Start) startup type. All other Canary services are set to Manual and are started by the Canary Services Starter. The Canary Services Starter is not designed to start the Data Generation service.
- Unzip and place the ComalAndGuadalupe.dgf file attached at the top of the article in C:\ProgramData\Canary\DataGeneration.
- Edit the data_generation.service.json file found in the same directory and add the filepath of the dgf file. Save changes.
{ "RunFiles": ["C:\\ProgramData\\Canary\\DataGeneration\\ComalAndGuadalupe.dgf"] } - Restart the Canary Data Generation service to pick up the new changes. The Data Generation service should now be publishing data to the local Mosquitto broker.
Creating an MQTT Collector Session
- Open the MQTT Collector tile within the Canary Admin. By default, an example session is already created that targets a local broker.
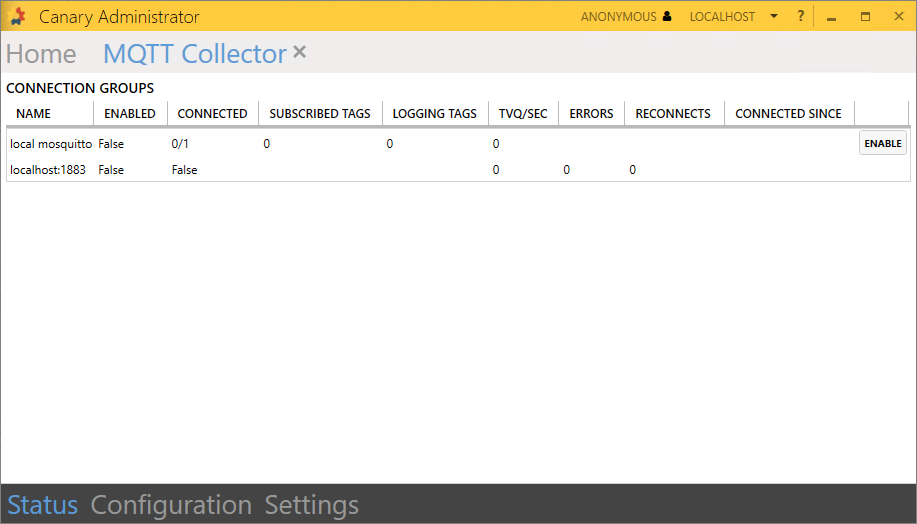
- Select the Configuration tab at the bottom of the screen then add (+) a new Connection Group from the left-hand side. APPLY changes. (You may want to collapse the 'local mosquitto' example.)
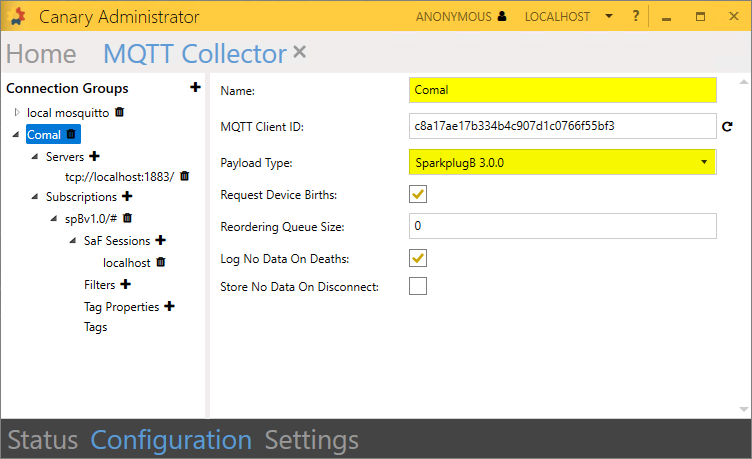
- Make the following changes and APPLY:
- Name = Comal
- Payload Type = SparkplugB 3.0.0
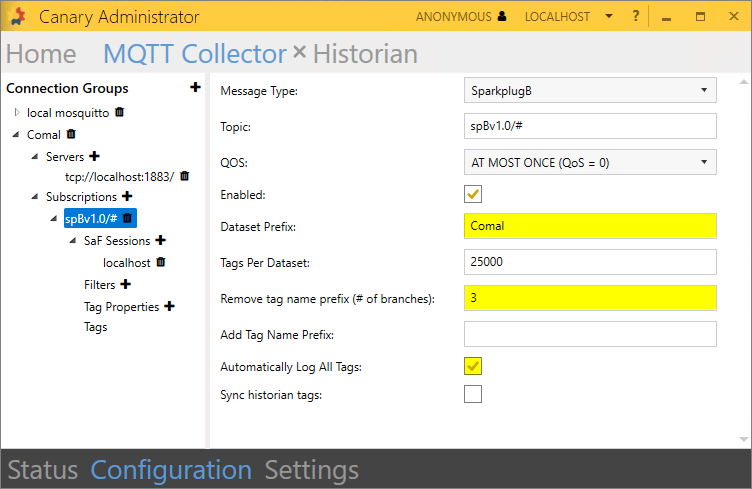
- Select the spBv1.0/# subscription topic and update the following settings:
- Dataset Prefix = Comal
- Remove tag name prefix = 3
- Automatically Log All Tags =

By default, a connection group is configured to subscribe to ALL topics within the MQTT server using the syntax spBv1.0/#. The user could specify a more specific topic in other circumstances, but for this project we will use the default and add a filter in the next step to only include specific tags within that topic.
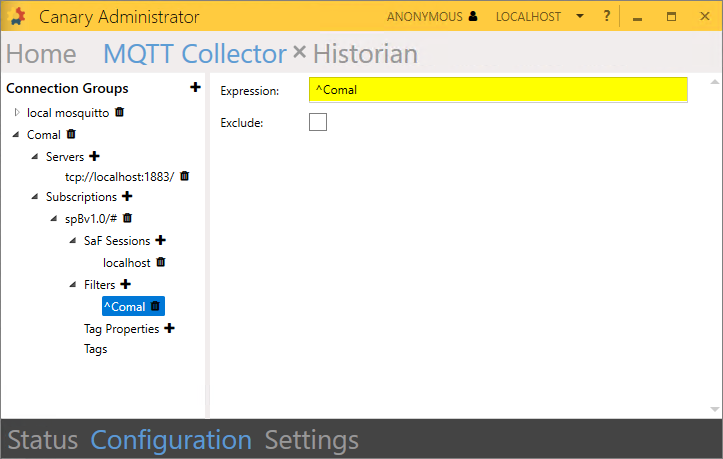
- Add (+) a filter and set the expression to '^Comal'. With Automatically Log All Tags enabled and the first 3 branches removed, this will only log tags that start with Comal.
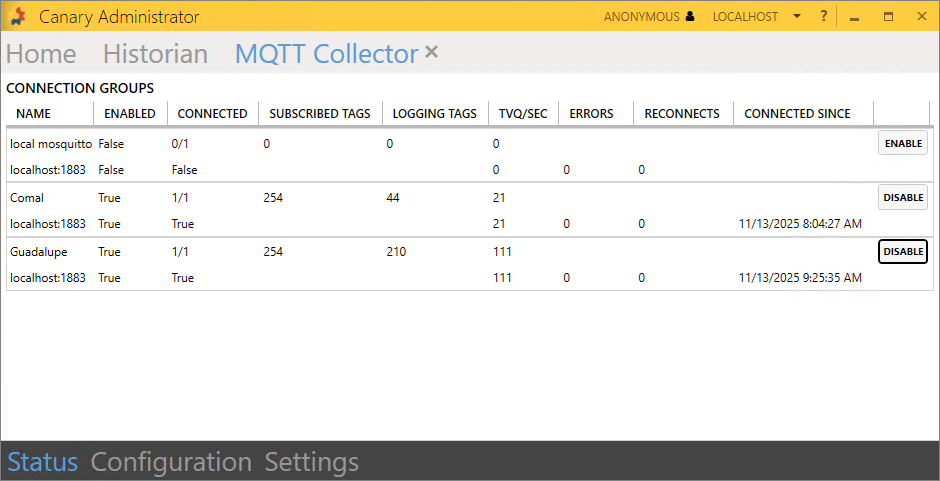
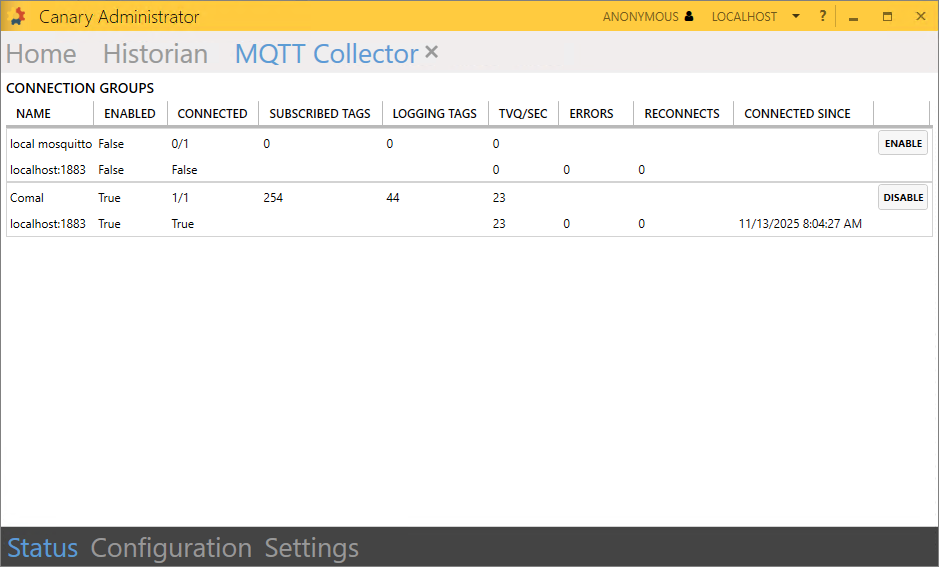
- Navigate back to the Status screen and Enable the Comal session. Verify there are 254 subscribed tags and 44 logging tags.
When a session is enabled, the Tags table is populated with all of the tags that fall under the subscription topic. Those that are being logged will have a checkmark in the ENABLED column. In this case, only the tags that start with 'Comal' are enabled.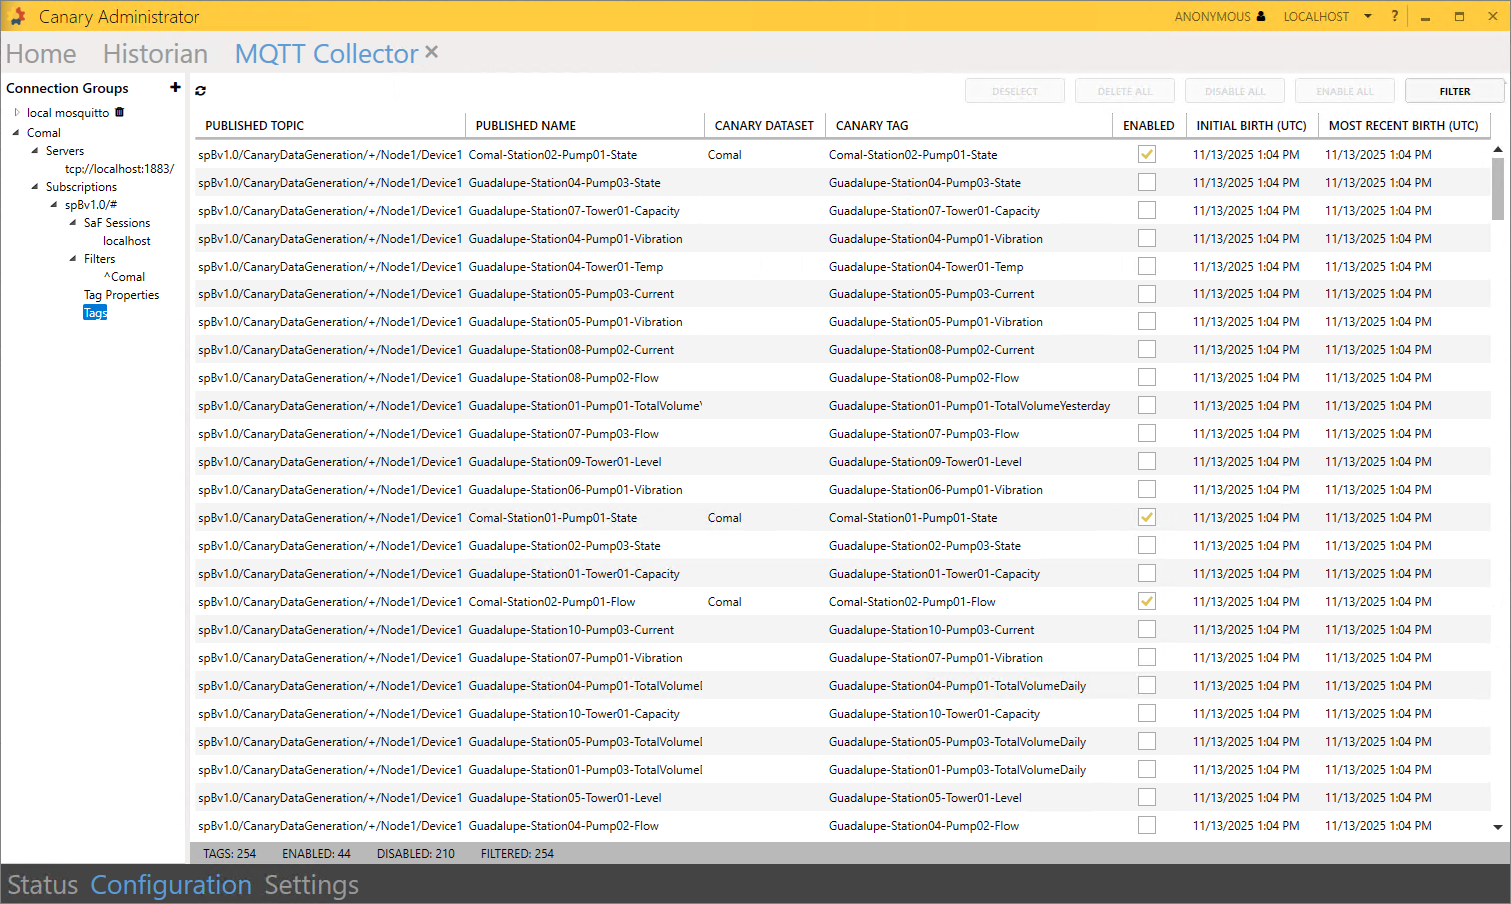
The settings in this table are "sticky". If you were to disable the session and make changes to the Connection Group, it would not affect the tags that already exist in the table. The new settings would only apply to new tags as they were birthed. If you would want to make changes to the current tags, you would need to DELETE the Tags table then re-enable the session with the new settings.
Adding Another Connection Group
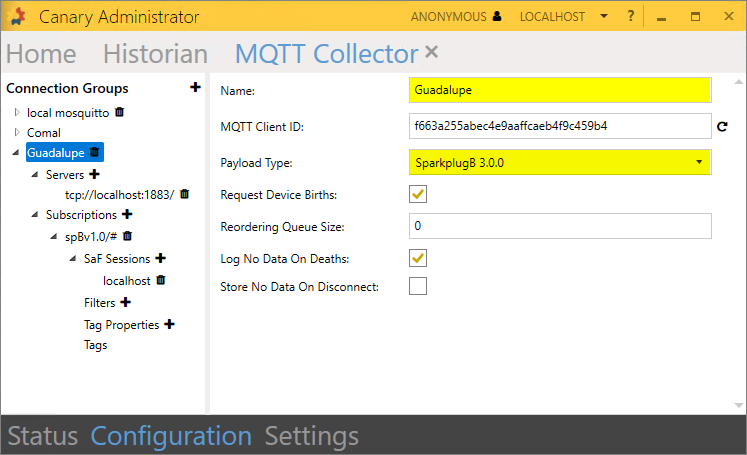
- Add (+) another Connection Group and name it 'Guadalupe'. Set the Payload Type to SparkplugB 3.0.0. APPLY changes.
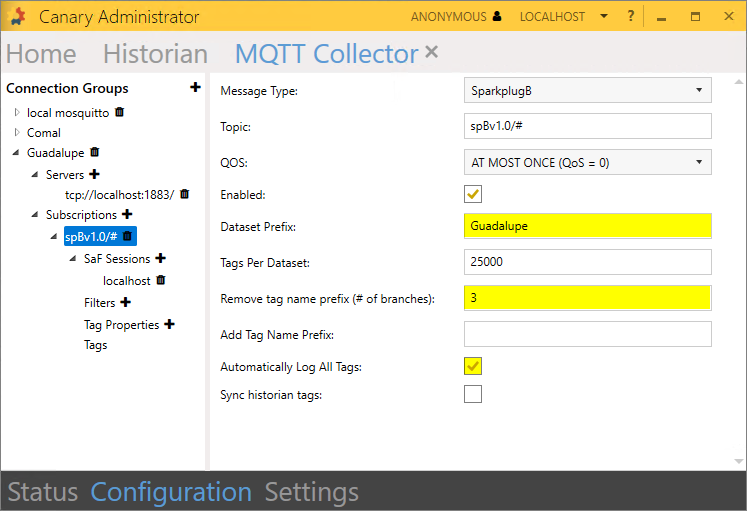
- Update the Subscription settings and APPLY changes:
- Dataset Prefix = Guadalupe
- Remove tag name prefix = 3
- Automatically Log All Tags =
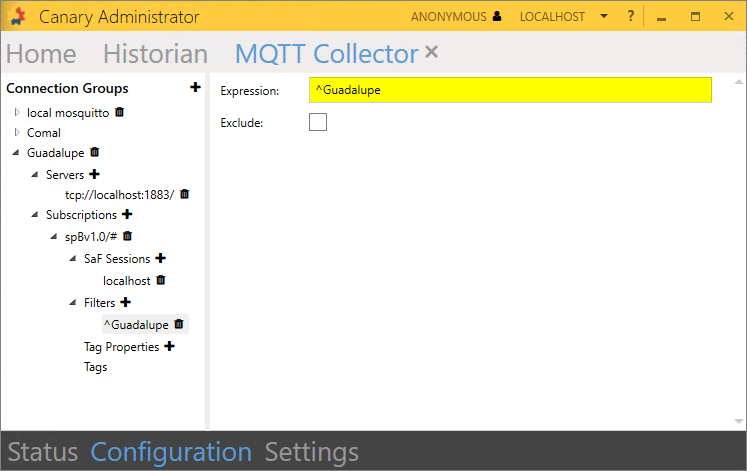
- Add (+) a '^Guadalupe' filter.
- Navigate to the Status screen and Enable the Guadalupe session. You should see the same 254 subscribed tags as the Comal session but with 210 being logged.