
-
Report Admin Can View Generated Reports From All Users
It would be very helpful if the Report Admin feature allowed for viewing generated reports from all users. That way they could check to see if reports are generating correctly.…
-
Ad Hoc Trend Using Multiple Symbol Tags
Given that you can double click on a symbol to get an ad hoc chart of the tag it is mapped to in a new tab, it would be useful/be a timesaver to be able to select multiple symbols (usually…
-
Axiom Displays - Move to a new Server
Hi There, I have a client deploying a new Canary Server (local instance) and they want to copy/move the Axiom displays that were created on the off-prem Canary Server.…
-
Workflow Improvement: Allow Copying and Editing Selected Trend Tag Paths
Please add Copy and Edit actions to the Selected Trends section. This is a clear "quality-of-life" improvement to general daily workflow with Axiom. The Copy action would copy the selected tag path…
-
Multiple "cursors" in chart
It would be very nice with an option to add "lines" into the chart. Similar to cursor, but not "attached" to the mouse movement, rather a line you can set in a certain position and it stays there,…

-
1st Axiom Dashboard
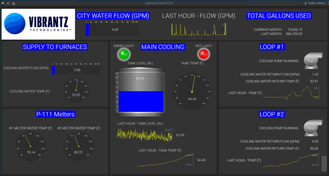
I'm new to the Canary community and we recently launched our Production environment built from our excellent Demo experience. The dashboard above was my first Axiom creation and is actively used at…
-
Add Time Zone Visibility or Allow Time Format Customization
Please add the ZONE abbreviation or better yet allow us to adjust time format. We have facilities in 4 time zones. Since there is no easy way to switch your time zone and/or see what your set to,…
-
AXIOM - Unexpected exception occurred. Value cannot be null
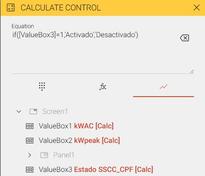
Hello, A few days ago, this error message started appearing in some of our Axiom applications, where I display value boxes with conditions (an “if” equation in a calculate control) that depend on the…

-
Repositioning floating label in zoom mode
On v26.1 I noticed that dragging a floating label in zoom mode will zoom the chart based on the mouse down/up positions. This doesn't happen in cursor mode.…
- Acknowledged
-
Add StartTime to Event Table
Add StartTime to the Event table to view historical events.
-
REST API Endpoints for Managing Axiom
Add REST API endpoints for managing Axiom applications and charts. This would allow us to programmatically create, edit, and copy dashboards across multiple sites instead of having to build/edit them…
-
Axiom v25.6 – Image control "Choose Image" fails silently in Chrome (works in Edge)
Hi everyone, We're running Axiom v25.6.0.25344 on Windows Server with the Canary Axiom service listening on port 443 (no reverse proxy, direct HTTPS). We've hit an issue with the Image control in…
- Fixed
-
Option to show state description in trend chart legend instead of value when using drawing mode = state
I like how the cursor shows the state description (e.g. "empty" in the screenshot below). It would be nice if there was an option at least to make the legend show the same thing (e.g.…
-
Axiom Value Box with a calculated time delay
Hello, I am attempting to create a value box that has a time delay behind another value box directly tied to a received value. Here are some specifics. Consider four Value Boxes:…
-
Trend Chart - Scale Range Dropdown Not Working
When I right click the scale for a trend chart, and then select the dropdown for Scale Range, the dropdown automatically closes without allowing a selection.…
- Fixed
-
Control auto width / height documentation
I just accidentally discovered that entering a height or width of zero will extend the control to the screen extent, starting from the x/y coordinates. This is something I wish I knew months ago.…
- Released
-
Axiom Trend Display Name Not Modifiable
New in V25.5, I can no longer edit the display name of a trend in Axiom. If I try and type anything into the "Display Name" field, it is immediately overwritten with the default settings and reverts…
- Fixed
-
Donut Gauge Control (version 25)
Properties *Name - a unique name used to reference the control in script AggregateInterval - the amount of time within each interval over which the data is processed using an AggregateKind (e.g.…


-
Axiom trend zooming
It can be cumbersome to switch between cursor/zoom/annotate modes inside trends. I'm proposing some shortcuts: 1) Hold the shift key in cursor mode to zoom 2) Drag in cursor mode to measure a delta…
-
Global start and end-time property for application
Next level functionality for us would be the ability to control the start and end-time of all components in an application, so it can be possible to create reports based on production…
-
Axiom list box IsMultiSelectEnabled
Hello, I'm using a list box to configure a grid template filter. When IsMultiSelectEnabled = false the item boxes change from a checkbox to a radio button, implying one option must always be selected.…
- Answered
-
Axiom Chart - Break in Data isn't reflected in Chart Data
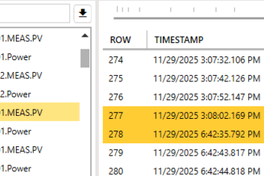
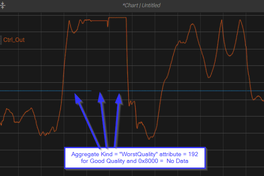
I have a situation where we had a power outage for about 3.5 hours and when looking at the chart data, the unchanged data is what is shown in the charts during this power outage.…
-
AxiomCore2 EventManager+CacheableBatchEventsRequest was not present in the dictionary
We keep receiving the following error when navigating to any tab in this particular application. first two tabs are basic trends, third tab is an events table that seems to be populating fine.…
-
Auto select time period based on tag value for batch
This may be the same thing (or part of it) that was suggested here: https://helpcenter.canarylabs.com/t/g9hgphz/golden-batch-eventstrends just in case though...…
- Answered

-
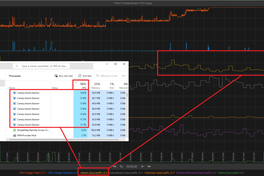
Canary.Axiom.Session eating CPU Usage% - What is this Service?
We have an instance where there is a math added to some charts (I've asked that they move the math to the calculations module and pull that calculated data) But while troubleshooting this I went to…
Welcome to the community!