
Trend Graph Control (version 25)
When embedding a Trend Graph control into an application, the user will have the option to Add trends or import a chart that was previously created. If importing a chart, it is important to note that once the application is saved, a unique copy of the chart is saved within the application itself. Updates or changes made to the original chart file, thereafter, will NOT appear in the application.
General Properties
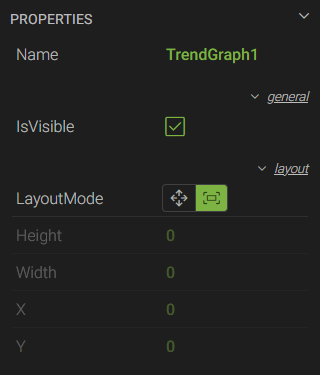
- *Name - a unique name used to reference the control in script
- IsVisible - a checkbox to show or hide the control
- LayoutMode - determines whether or not the control will fill the container it is placed in
- Height - the height of the control in pixels
- Width - the width of the control in pixels
- X - the horizontal coordinate of the top-left corner in relation to its parent container
- Y - the vertical coordinate of the top-left corner in relation to its parent container
*These properties are only available to Canary users listed on the Axiom>Script access control list within the Identity tile.
Asset Properties
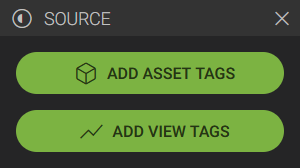
Asset properties are only visible if a Virtual View has been created within the Canary system where assets are defined. If an AssetType is configured for the Trend Graph, the user will have the option of adding asset tags or normal view tags.
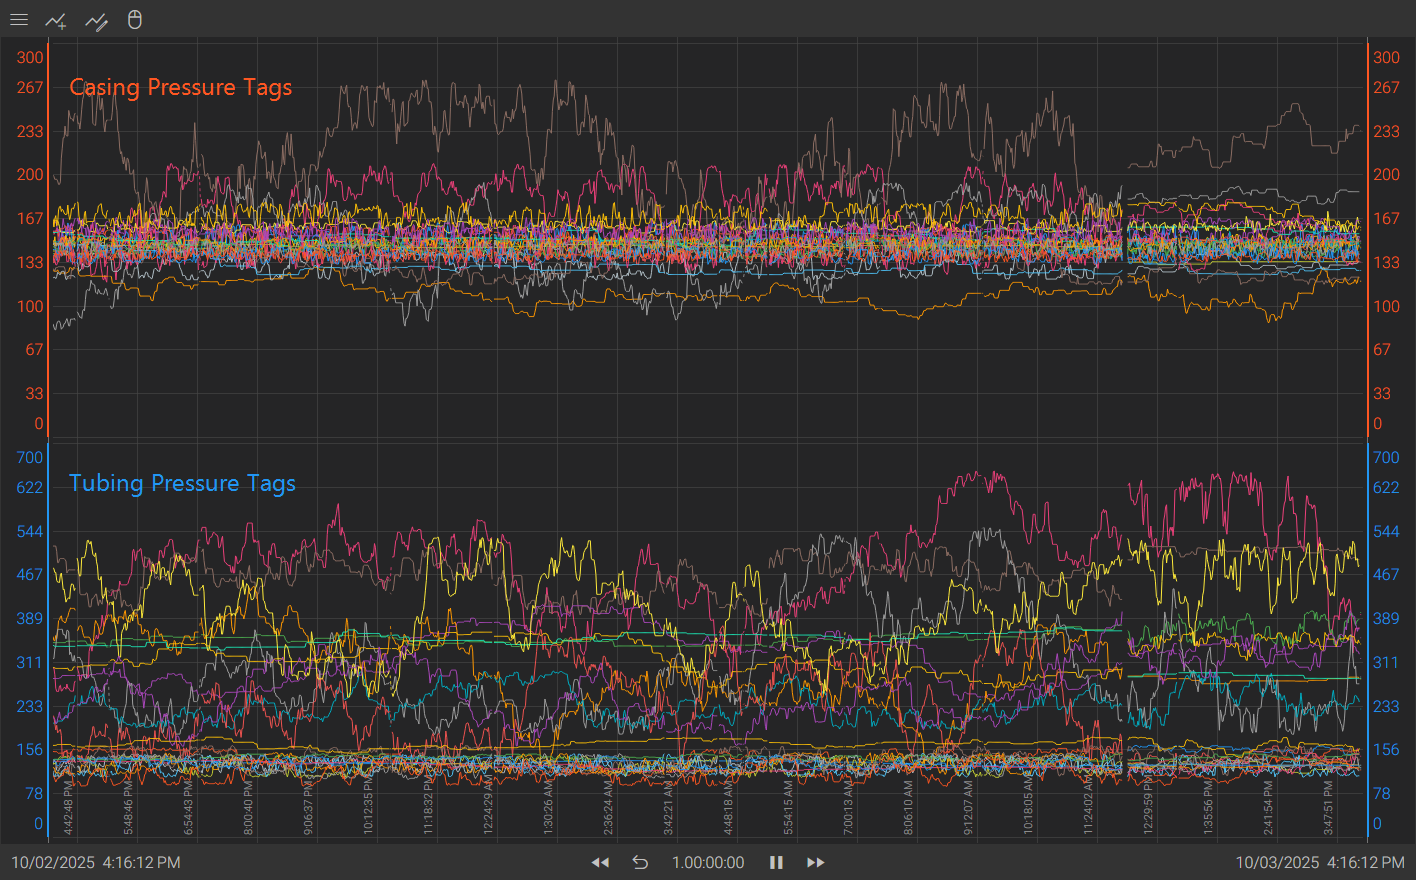
When adding asset tags, a tag from each asset instance is added to the chart assuming it does not exceed the AssetInstanceMaxCount. Tags of the same metric type will share the same vertical band space on the chart as seen in the screenshot below:
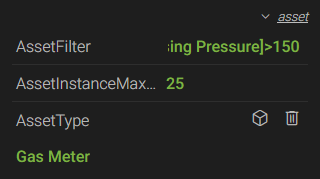 AssetFilter - an expression or statement used to filter the asset instances shown within the trend graph. Only applicable if the graph is configured for a specific AssetType. For examples of how to apply different filters, see How To Filter Asset Templates, Grids, and Asset-Based Trend Graphs.
- AssetInstanceMaxCount - the maximum number of asset instances that will be trended on the graph. Only applicable if the graph is configured for a specific AssetType.
- AssetType - opens the CONFIGURE ASSET TYPE menu to select a Virtual View and an asset type defined in that view.
Event Properties
Event properties were introduced in v25.4.
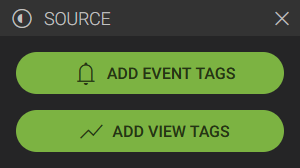
If an EventType is selected for the Trend Graph, the user will have the option of adding event tags or normal view tags.
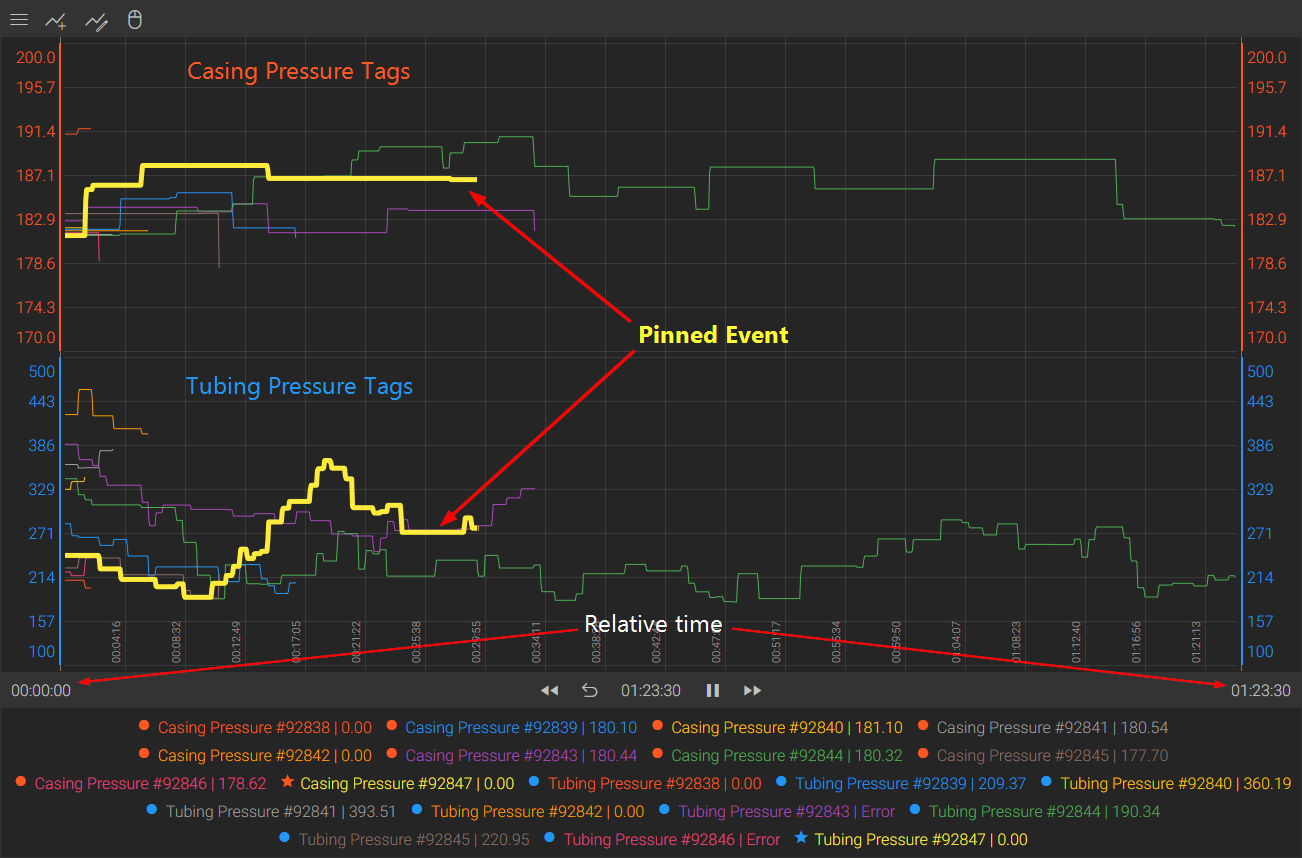
When adding event tags, the chart will enter into an "event" mode where the start and end timestamps on the time bar will display relative times starting from 00:00:00 up until the end of the longest event, instead of actual date times.
When the chart is in live mode and an event instance is currently in process, other event instances on the chart will appear dimmed until the current instance completes. Pinned events will be drawn with a thicker line style.
A trend graph can only be configured for an EventType or an AssetType, not both. If both are configured, EventTypes take precedence.
Tags of the same metric type will share the same vertical band space on the chart as seen in the screenshot below:
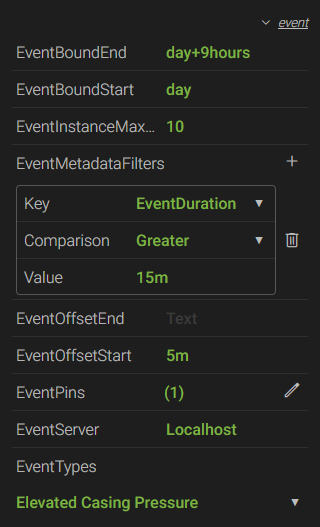 EventBoundEnd - the end time of the range of events to query. Time values can be actual (9/26/2025 7:45 AM) or relative (day+8hours-15minutes, d+8h-15m).
- EventBoundStart - the start time of the range of events to query. Time values can be actual (8-9-2016 7:30 PM) or relative (day+7hours+30minutes, d+7h+30m).
- EventInstanceMaxCount - the maximum number of event instances to trend on the chart. If using the EventBoundStart and EventBoundEnd properties, the most recent events that fall within this time range will be returned. If no time frame is provided, the most recent events up until Now, not to exceed the max, will be returned.
- EventMetadataFilters - filters the event instances to be returned based on a Key and its Value. Keys include EventStatus (whether the event is Completed, Active, or Aborted); EventDuration (Values can actual or relative times); and any {EventProperties} that are attached to the event.
- EventOffsetEnd - time that is padded to the end of an event instance. Times can be actual (00:00:30) or relative (30seconds, 30s).
- EventOffsetStart - time that is padded to the beginning of an event instance. Times can be actual (1.00:00:00) or relative (1day, 1d).
- EventPins - similar to a "golden batch", these events are pinned to the chart regardless of the time frame or filters that are applied. Pinned events are pronounced with a thicker line and indicated with a star next to them in the legend. Users can select which event(s) to pin using the BROWSE EVENTS menu.
Events can be filtered by their start and end time, source path, and properties.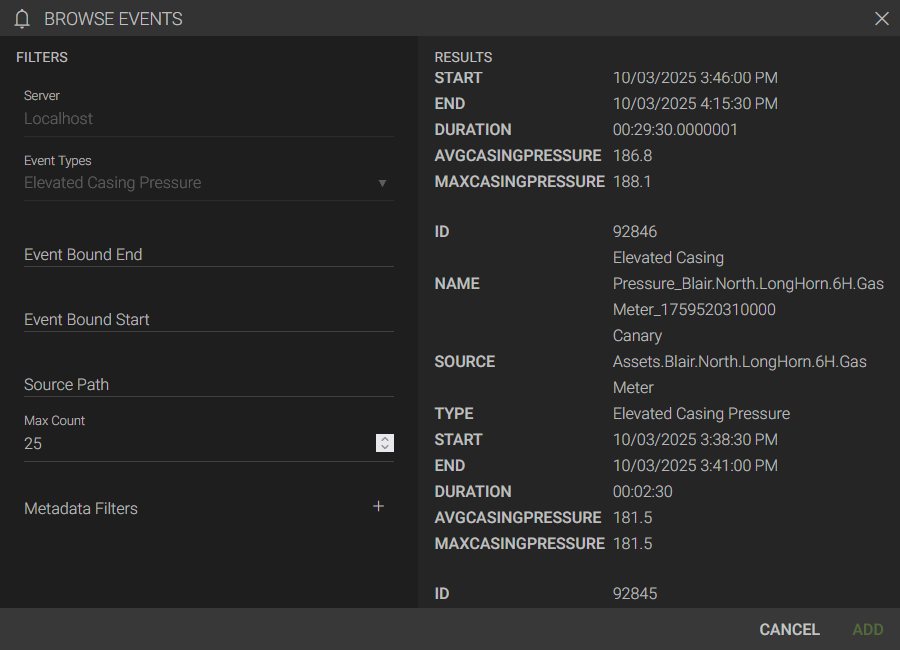
- EventServer - server name of the Views service Axiom connects to to retrieve events. (This will almost always be localhost unless the Views service is remote from the Axiom core.)
- EventTypes - a list of Event types that have been created in the Canary System. An EventType must be selected if wishing to plot tags on the chart which pertain to the selected event.
For more information on Trend Graph controls, see Charts.