
0
Bar Chart Control (version 26)
Knowledge Base / Version 26 / Client Tools / Axiom / Applications

Properties
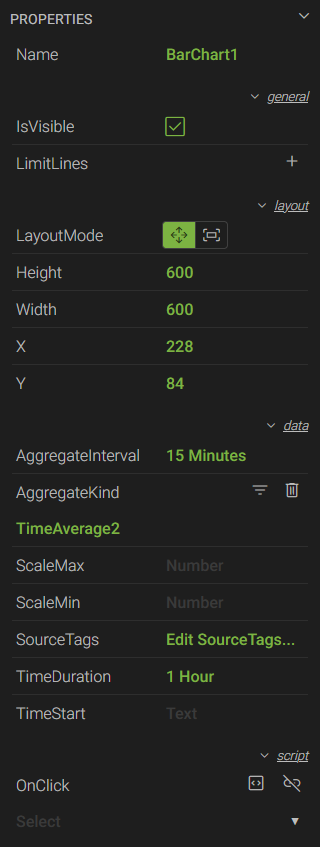 *Name - a unique name used to reference the control in script
- IsVisible - a checkbox to show or hide the control
- LimitLines - expands the menu to add a limit line(s) to the chart which can be set to a static value or linked to a tag
- LayoutMode - sets the size of the control based on the Height and Width properties (Move), or fills the entire space of its parent container (Fill)
- Height - the height of the control in pixels
- Width - the width of the control in pixels
- X - the horizontal coordinate of the top-left corner in relation to its parent container
- Y - the vertical coordinate of the top-left corner in relation to its parent container
- AggregateInterval - the amount of time within each interval over which the data is processed using an AggregateKind (e.g. 15 minutes, 15m, 00:15:00)
- AggregateKind - the aggregate used to process the data over a given AggregateInterval
- ScaleMax - sets the maximum value of the scale
- ScaleMin - sets the minimum value of the scale
- SourceTags - opens the TAGS menu where users can add (+), delete (
 ), or rearrange (
 ) tags
 - TimeDuration - the total amount of time to be used for the x-axis (e.g. 1 hour, 1h, 1:00:00)
- TimeStart - the point in time in which the TimeDuration starts. Times can be relative or actual (e.g. day, day - 6h, 9:00 PM). The default value is "Now - TimeDuration" if left blank.
- *OnClick - used to trigger a script that runs when the bar chart is clicked
* These properties are only available to Canary users listed on the Axiom>Script access control list within the Identity tile.