
4
Connecting Canary to Power BI (version 24)
Knowledge Base / Version 24 / Client Tools / Using Canary's APIs
This article will take you through the process of reading data out of the Historian and into Power BI using Canary's web Read API. The Read API connects to the Views secure endpoint (55236) over https.

Configuration
- Configure the Views service to use a trusted certificate.
Power BI does not trust the self-signed certificate Canary generates by default and throws an error when attempting to connect.

A valid certificate must be installed on the server with the Views service configured to use it. Certificate information can be updated by navigating to the Views tile>Configuration>Endpoints screen shown above. Select Certificate from the Kind drop-down then choose the appropriate Store Name, Find Type, and Subject Name based upon the newly installed trusted certificate. - Create an API token within the Identity service that will be used when authenticating the API requests.

- Open Power BI and select Get data. Choose the Web source.

- Select the Advanced option and enter the URL.
There are two options for requesting tag data:
- Explicitly adding every tag in the URL using the tags parameter. This method can be cumbersome if needing to request data for many tags.
- Using the path, deep, and search parameter. Path allows you specify a branch or view within the Views service to look for tags. Deep determines if it should return tags for any subnodes of the specified path. Search allows you to filter the tags to only return those that contain the keyword.
- Add an Authorization header and set its value to Bearer <apiToken>. This is the token that is created in Step 2.

- Click OK.
- Select the Anonymous tab and click Connect.

Transforming the Data
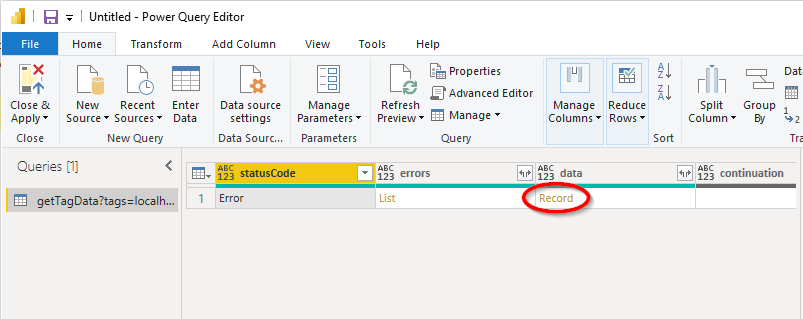
- Power BI will attempt to transform the data into what it thinks is a usable format. These APPLIED STEPS will appear on the right-hand side. Remove 'Changed Type' and 'Expanded data' from this list by clicking the 'X' next to each item.

- Select 'Record' under the 'data' column'.
- Convert the Record into a Table by selecting the 'Into Table' button in the top-left corner.

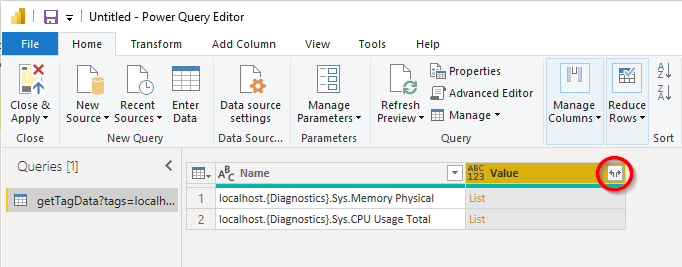
- Click the
 button in the 'Value' column and select 'Expand to New Rows'.
- Repeat this process again by clicking the
 button in the 'Value' column then selecting 'OK'.

- Right-click on the 'Value.t' column header and select 'Change Type'. Choose 'Date/Time/Timezone'.
- Repeat this process for the 'Value.v' column. Set its type to 'Decimal Number'.
- Select 'Close & Apply' in the top-left corner to apply these changes.
Visualizing the Data
Once the data transformation is complete, the user will be presented with a blank canvas to build a report.
- Select the Clustered column chart from the Visualizations menu.

- Expand the getTagData... table in the Fields column to show Name, Value.t, and Value.v.

- Click-and-drag Name into the Legend field, Value.t into the Axis field, and Value.v into the Values field.

- Click the down-arrow in the 'Axis' field and select 'Value.t'.

- Finished!
