
0

SQL Collector Axiom issue

There is a dataset which is using SQL collector to get data.

The sample interval is about 10 mins for example.

In case the data is not updated due to error on data source error or something

SQL collector seems to have this issue on axiom flat-lining at last good value.

 If some tags are not getting updated, I think there should be no data,

but until it's flat-lining until it's updated with new values.

This flat line can be confusing, as users don't know whether it's not being updated for a long time

or whether they are just getting the same values over and over.

and this can result in events not properly working, as well.


Would there be any solution to make it 0 or no data? when it's not updated?


Thanks!

2 replies

null
    • smason
    • 15 hrs ago
    • Reported - view

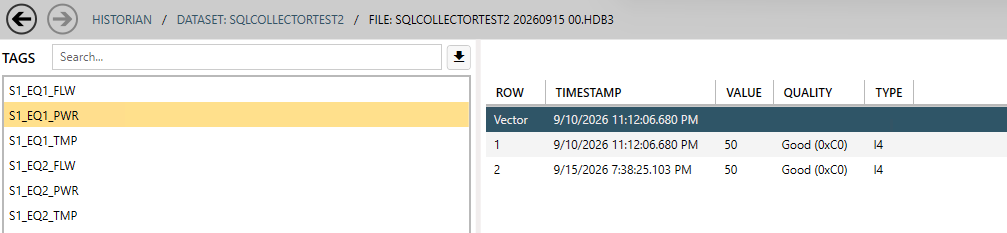
    Axiom will time-extend the last value in the Historian if the tag is in an active S&F session. I wouldn't expect that to happen with the SQL Collector as it closes the S&F session once it has processed the data for each batch. What does the data look like in the Historian tile in the Admin? Is it possible we're getting the same value at later timestamps which woudl create the flat line?
      • Software Developer | System Integrator
      • tedkdj88
      • 13 hrs ago
      • Reported - view


      Hello Steve,


      for example, for testing I have inserted value of 50, through SQL collector, at 9/15/ 7:38:25.103PM.

      Afterwards no more values have been added intentionally to compare the axiom dashboard.

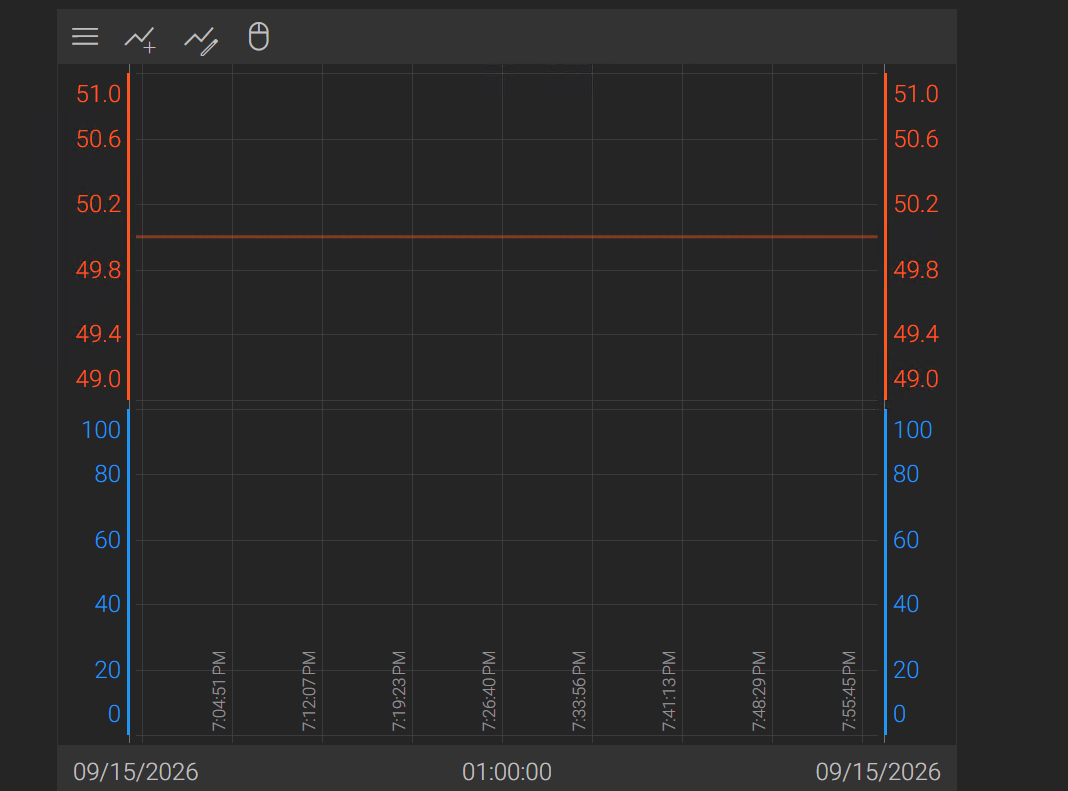
       And This is the trend graph on axiom. if you look at X axis,

      the value stays at 50 until 7 : 58PM(latest time during the testing on VM).

      And this is S&F and SQL Collector Connection info, respectively

      S&F session is not disconnected even though there has been no values added for the past 20 mins.

      If this scenario were like data are added every 3 mins or 5 mins or whatever is short than 20mins,

      Users would get confused whether they are getting the same values at later timestamps, as you mentioned, or it is just, by default, staying at the last good value of mins or hours back.

      ---

      To temporarily fix this issue,

      For production server, I've edited my SQL procedure so that it regularly monitors 'data insert timestamp' from data source DB, and if some values are not updated for over 1 hour, then the prcedure adds just '0' to the table that Canary is looking at for data collecting. So, users' trendgraph value is not staying at, say, 200 but drops to 0, indicating there's an issue.


      Hope this issue could be resolved. Thanks.

Content aside

print this pagePrint this page
  • 13 hrs agoLast active
  • 2Replies
  • 17Views
  • 3 Following

