
High CPU Usage if OPC Collector Fails to Connect OPC Session
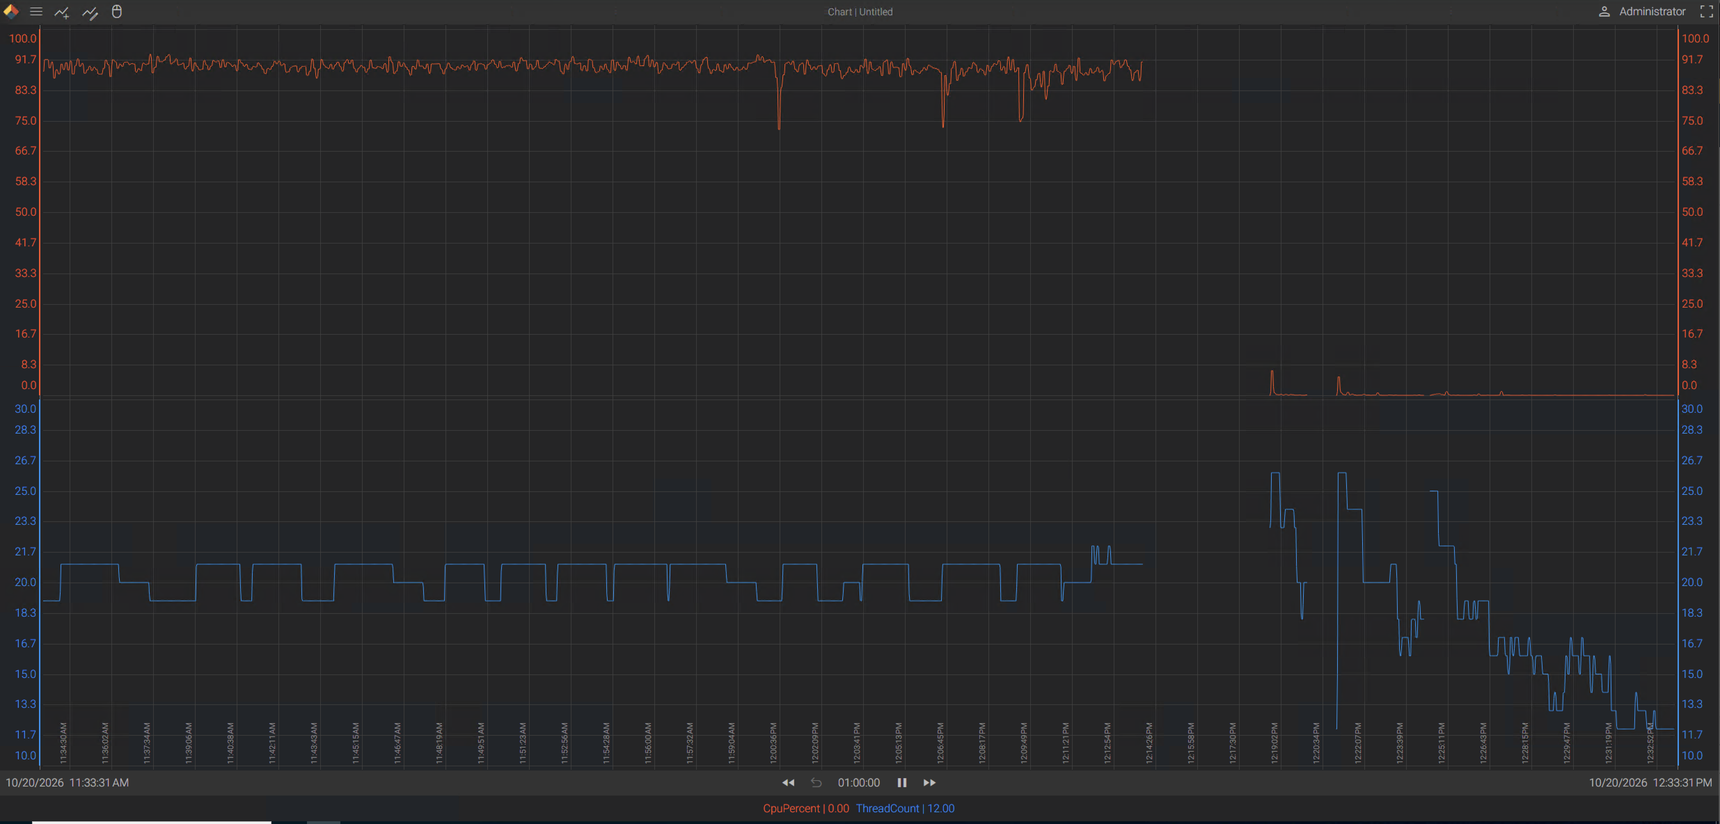
When the OPC Collector fails to establish a session with an OPC server, the collector process experiences abnormally high CPU utilization. The charts show usage when the session failed to connect versus when the session is connected normally. The session is ~280 tags.
<LOCALHOST>{hostname}.{Diagnostics}.Health.{hostname}.Collector.OPC_UA.Process.CpuPercent
<LOCALHOST>{hostname}.{Diagnostics}.Health.{hostname}.Collector.OPC_UA.Process.ThreadCount
OPC Collector: 26.5.0.26173
2 replies
-
I think I've seen this before! It's been a while. It was case 15586 for whoever sees this.
-
Hi ,
Are you able to replicate it on your side easily enough? We haven't been able to. If you can, we would recommend creating a dump file of the OPC Collector while it is in that state. That would give us a better understanding of what is happening and/or why it's consuming CPU. Also, if there are any relevant messages in the message log when it occurs, that would be helpful. You can enable Trace messaging if it's in process, but I wouldn't leave Trace messaging on if it's not occurring as that will consume more resources.
 Print this page