
0

Data Table Control (version 22)
Knowledge Base / Version 22 / Client Tools / Axiom / Applications
The 'Data Table' control displays raw or processed data provided an 'AggregateInterval' and 'AggregateKind' are specified. The most recent x (not to exceed 1000) rows of data are displayed unless a 'TimeEnd' is specified, in which case, the most recent rows leading up to to this time will be displayed.
Right-clicking on the control gives the user the option of copying the data to the clipboard or creating a CSV file.
Properties
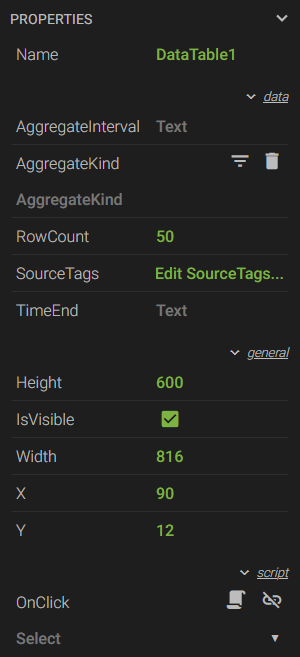 Name - a unique name used to reference the control in script *
- AggregateInterval - the amount of time within each interval over which the data is processed using an 'AggregateKind' (e.g. 15 minutes, 15m, 00:15:00)
- AggregateKind - the aggregate used to process the data over a given 'AggregateInterval'
- Row Count - the number of rows (1-1000) to display
- SourceTags - opens the 'SOURCE TAGS' menu where tags can added/removed
- TimeEnd - the latest time boundary for displaying raw or processed data. Timestamps not to exceed this relative or actual time (e.g. day+14h, 2:00 PM, 14:00)
- Height - the height of the control in pixels
- IsVisible - a checkbox to show or hide the control
- Width - the width of the control in pixels
- X - the horizontal coordinate of the top-left corner in relation to its parent container
- Y - the vertical coordinate of the top-left corner in relation to its parent container
- OnClick - used to trigger a script that runs when the gauge is clicked *
* These properties are only available to admin users.