
Trend Graph displaying only an Event Duration
Hello,
I'm new to Canary, so please accept my apologies if this has been already discussed or answered (I could not find anything on this in the help center).
I'm trying to build an automated report that gets triggered after an event is completed. The report will show event completion information at that point in time (for example, some string tags, some device parameters such as speed or temperature, etc.) and we want to display two more things:
- Event information at the beginning of the event duration. This can be done through Event properties as per this post: Event Property Value for Beginning and End of Event - Calculations & Events - Canary Community although it would be great to have these as tags (as suggested here: Event Property Integration - Calculations & Events - Canary Community). Still, we can display these properties in the events table control.
- A trend graph of specific tags showing a timeline (by default) from the start of the event till the end of the event (showing the entire event duration on the trend graph). Something like the screen below.
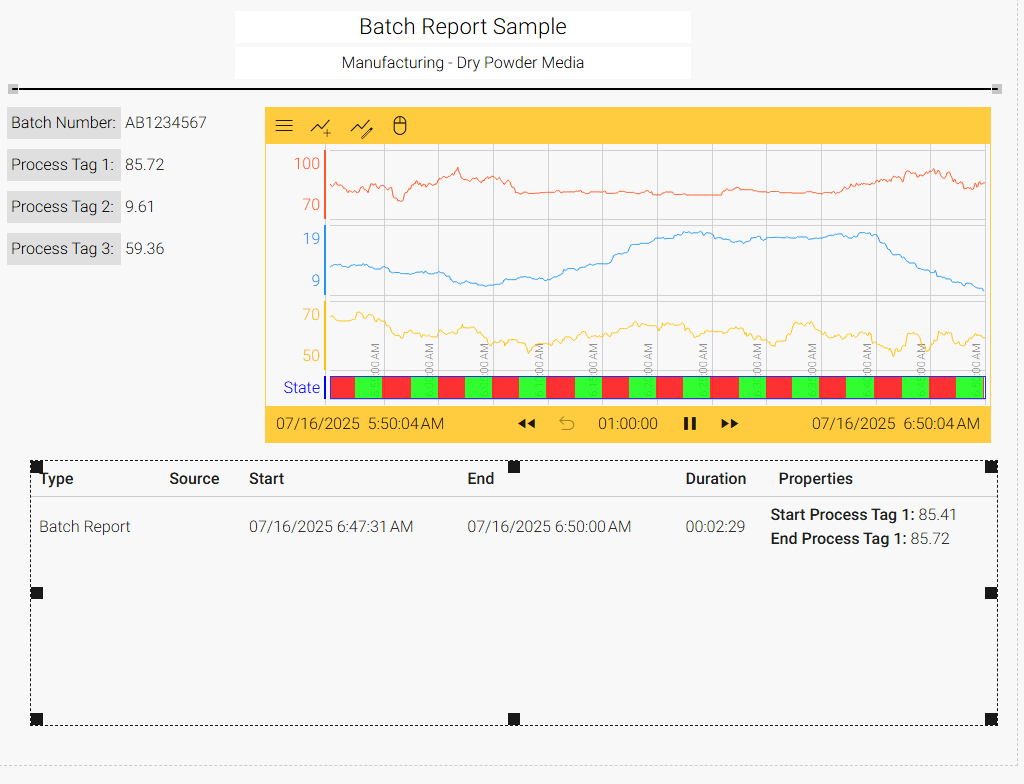
Is there a way to indicate the trend graph to show the tags display only for the start and end dates showing on the event table?
Thanks
4 replies
-
Hi ,
You should be able to accomplish this in v25.4 when we release our new batch functionality. You'll be able to display an event (or multiple events) in a trend chart within an application. The Events Table will also break down the event properties and give each its own column. Right now, we're looking towards the end of August for this release to be available.
-
Thanks for the update. To be sure I understand then: the trend chart will be able to visualize an entire event duration, and if an automated report is scheduled to run when an event is completed. that chart (configured to show the entire event's duration) will display the desired data. Is that correct?